OK.Wahl
Internetpräsentation
Version 2.2.12
Ergebnis zur Bundestagswahl 2017 am 24.09.2017
Wahlkreis Oberallgäu - Landkreis Lindau (Bodensee)
Es wurden alle Wahlbezirke ausgewertet.
 Diagramm
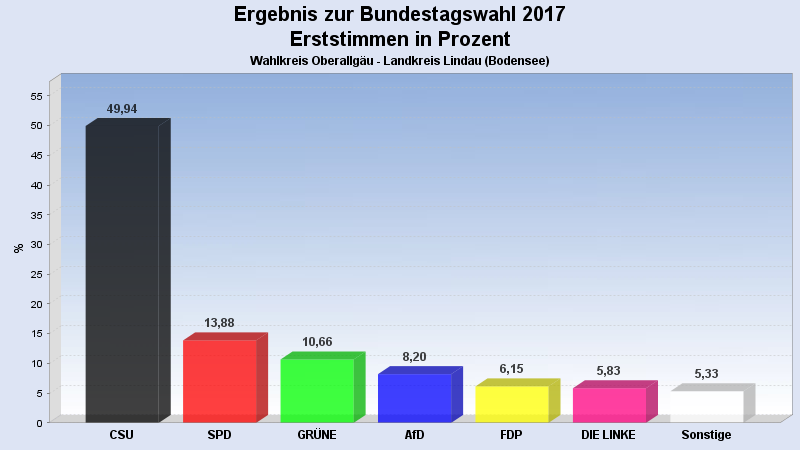
 Seitenanfang
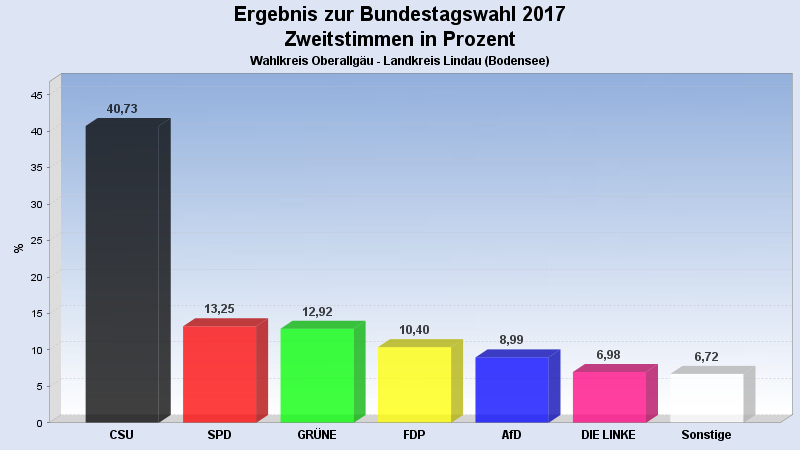
Wahlbeteiligung, Stimmzettel, Stimmen
| Wahlbeteiligung: | 78,17% |
|---|---|
| Wahlberechtigte: | 59.631 |
| Wähler: | 46.616 |
| Ungültige Erststimmen: | 322 |
| Gültige Erststimmen: | 46.294 |
| Ungültige Zweitstimmen: | 292 |
| Gültige Zweitstimmen: | 46.324 |
Erststimmen nach Wahlvorschlag
| Partei | Erststimmen | Prozent | |
|---|---|---|---|
| 1 | Dr. Müller, Gerd (CSU) | 23.120 | 49,94% |
| 2 | Schrader, Katharina (SPD) | 6.425 | 13,88% |
| 3 | Groll, Erna-Kathrein (GRÜNE) | 4.936 | 10,66% |
| 5 | Felser, Peter (AfD) | 3.798 | 8,20% |
| 4 | Thomae, Stephan (FDP) | 2.848 | 6,15% |
| 6 | Merk, Franz Xaver (DIE LINKE) | 2.699 | 5,83% |
| 7 | Wirthensohn, Hugo Michael (FREIE WÄHLER) | 1.406 | 3,04% |
| 9 | Fischer, Lucia Maria (ÖDP) | 722 | 1,56% |
| 10 | Dr. Kirchmann, Josef Anton (BP) | 340 | 0,73% |
Zweitstimmen nach Wahlvorschlag
| Partei | Zweitstimmen | Prozent | |
|---|---|---|---|
| 1 | CSU | 18.869 | 40,73% |
| 2 | SPD | 6.138 | 13,25% |
| 3 | GRÜNE | 5.987 | 12,92% |
| 4 | FDP | 4.819 | 10,40% |
| 5 | AfD | 4.164 | 8,99% |
| 6 | DIE LINKE | 3.235 | 6,98% |
| 7 | FREIE WÄHLER | 1.007 | 2,17% |
| 9 | ÖDP | 538 | 1,16% |
| 12 | Tierschutzpartei | 399 | 0,86% |
| 19 | Die PARTEI | 268 | 0,58% |
| 10 | BP | 267 | 0,58% |
| 8 | PIRATEN | 146 | 0,32% |
| 15 | BGE | 97 | 0,21% |
| 16 | DiB | 86 | 0,19% |
| 18 | DM | 85 | 0,18% |
| 21 | V-Partei³ | 82 | 0,18% |
| 11 | NPD | 70 | 0,15% |
| 20 | Gesundheitsforschung | 45 | 0,10% |
| 13 | MLPD | 9 | 0,02% |
| 14 | BüSo | 7 | 0,02% |
| 17 | DKP | 6 | 0,01% |
- Stand: 29.09.2017 10:43:06