OK.Wahl
Internetpräsentation
Version 2.2.12
Ergebnis zur Bundestagswahl 2017 am 24.09.2017
Wahlkreis Oberallgäu - Landkreis Oberallgäu - Stadt Immenstadt i. Allgäu
Es wurden alle Wahlbezirke ausgewertet.
 Diagramm
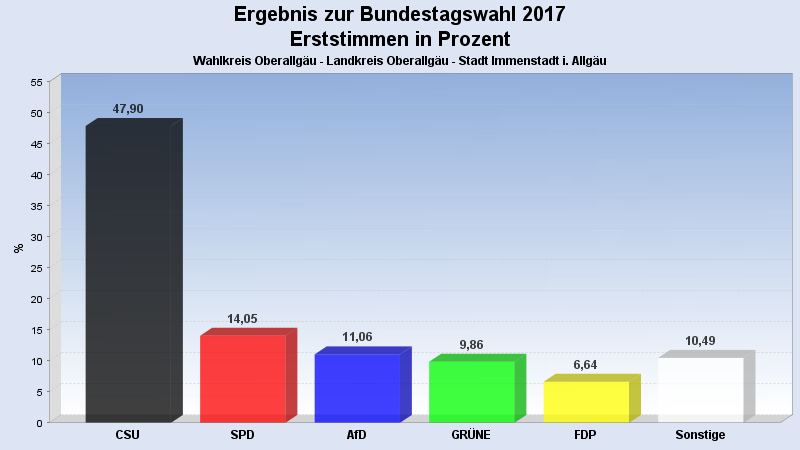
 Seitenanfang
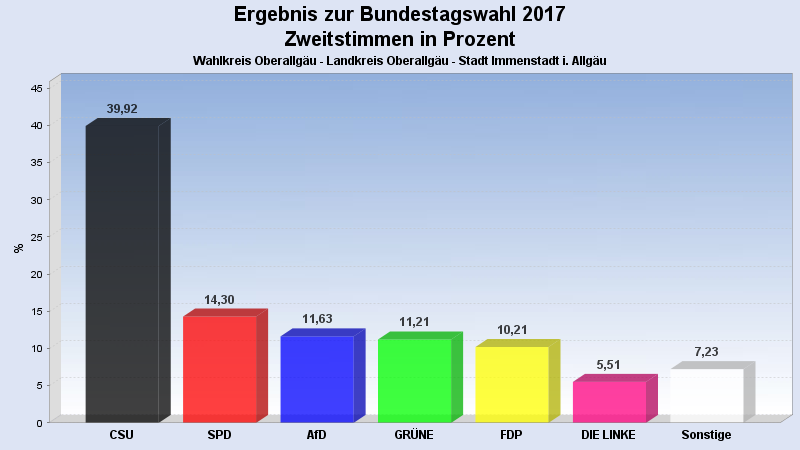
Wahlbeteiligung, Stimmzettel, Stimmen
| Wahlbeteiligung: | 74,27% |
|---|---|
| Wahlberechtigte: | 10.469 |
| Wähler: | 7.775 |
| Ungültige Erststimmen: | 54 |
| Gültige Erststimmen: | 7.721 |
| Ungültige Zweitstimmen: | 39 |
| Gültige Zweitstimmen: | 7.736 |
Erststimmen nach Wahlvorschlag
| Partei | Erststimmen | Prozent | |
|---|---|---|---|
| 1 | Dr. Müller, Gerd (CSU) | 3.698 | 47,90% |
| 2 | Schrader, Katharina (SPD) | 1.085 | 14,05% |
| 5 | Felser, Peter (AfD) | 854 | 11,06% |
| 3 | Groll, Erna-Kathrein (GRÜNE) | 761 | 9,86% |
| 4 | Thomae, Stephan (FDP) | 513 | 6,64% |
| 6 | Merk, Franz Xaver (DIE LINKE) | 351 | 4,55% |
| 7 | Wirthensohn, Hugo Michael (FREIE WÄHLER) | 259 | 3,35% |
| 10 | Dr. Kirchmann, Josef Anton (BP) | 104 | 1,35% |
| 9 | Fischer, Lucia Maria (ÖDP) | 96 | 1,24% |
Zweitstimmen nach Wahlvorschlag
| Partei | Zweitstimmen | Prozent | |
|---|---|---|---|
| 1 | CSU | 3.088 | 39,92% |
| 2 | SPD | 1.106 | 14,30% |
| 5 | AfD | 900 | 11,63% |
| 3 | GRÜNE | 867 | 11,21% |
| 4 | FDP | 790 | 10,21% |
| 6 | DIE LINKE | 426 | 5,51% |
| 7 | FREIE WÄHLER | 184 | 2,38% |
| 12 | Tierschutzpartei | 75 | 0,97% |
| 9 | ÖDP | 70 | 0,90% |
| 10 | BP | 65 | 0,84% |
| 19 | Die PARTEI | 45 | 0,58% |
| 8 | PIRATEN | 27 | 0,35% |
| 15 | BGE | 22 | 0,28% |
| 11 | NPD | 19 | 0,25% |
| 21 | V-Partei³ | 14 | 0,18% |
| 16 | DiB | 13 | 0,17% |
| 20 | Gesundheitsforschung | 10 | 0,13% |
| 18 | DM | 9 | 0,12% |
| 17 | DKP | 3 | 0,04% |
| 13 | MLPD | 2 | 0,03% |
| 14 | BüSo | 1 | 0,01% |
- Stand: 29.09.2017 10:46:55