OK.Wahl
Internetpräsentation
Version 2.2.12
Ergebnis zur Landtagswahl 2018 am 14.10.2018
Stimmkreis Lindau - Sonthofen - Landkreis Lindau (Bodensee)
Es wurden alle Stimmbezirke ausgewertet.
 Diagramm
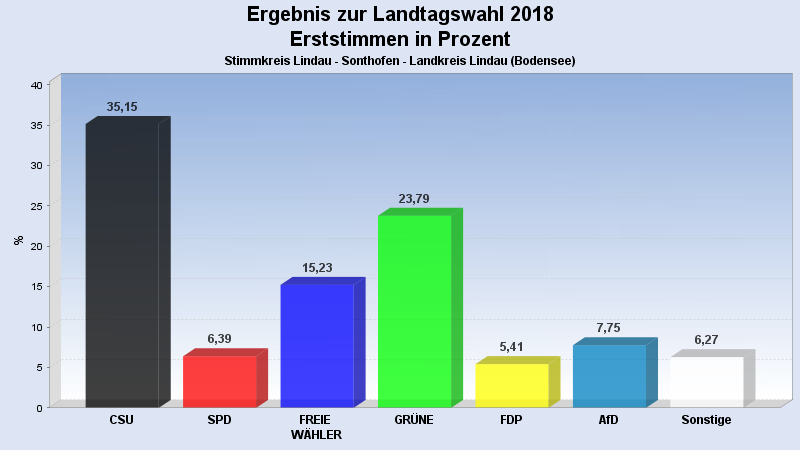
 Seitenanfang
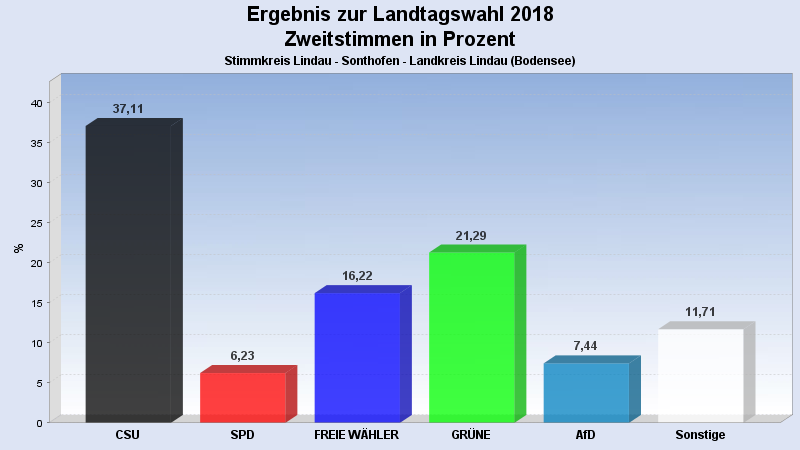
Wahlbeteiligung, Stimmzettel, Stimmen
| Wahlbeteiligung: | 68,68% |
|---|---|
| Stimmberechtigte: | 59.117 |
| Wähler: | 40.604 |
| Ungültige Erststimmen: | 327 |
| Gültige Erststimmen: | 40.276 |
| Ungültige Zweitstimmen: | 687 |
| Gültige Zweitstimmen: | 39.914 |
Erststimmen nach Wahlvorschlag
| Partei | Erststimmen | Prozent | |
|---|---|---|---|
| 1 | Beißwenger, Eric (CSU) | 14.156 | 35,15% |
| 2 | Maffenbeier, Michael (SPD) | 2.575 | 6,39% |
| 3 | Dr. Herz, Leopold (FREIE WÄHLER) | 6.134 | 15,23% |
| 4 | Gehring, Thomas (GRÜNE) | 9.583 | 23,79% |
| 5 | Dr. Spitzer, Dominik (FDP) | 2.180 | 5,41% |
| 6 | Schlotter, Michael (DIE LINKE) | 1.379 | 3,42% |
| 7 | Leising, Otto (BP) | 405 | 1,01% |
| 8 | Finger, Michael (ÖDP) | 458 | 1,14% |
| 10 | Keib, Axel (AfD) | 3.122 | 7,75% |
| 12 | Hüntemann, Matthias (mut) | 85 | 0,21% |
| 14 | Herzog, Stefan (V-Partei³) | 199 | 0,49% |
Zweitstimmen nach Wahlvorschlag
| Partei | Zweitstimmen | Prozent | |
|---|---|---|---|
| 1 | CSU | 14.813 | 37,11% |
| 2 | SPD | 2.487 | 6,23% |
| 3 | FREIE WÄHLER | 6.473 | 16,22% |
| 4 | GRÜNE | 8.497 | 21,29% |
| 5 | FDP | 1.598 | 4,00% |
| 6 | DIE LINKE | 1.511 | 3,79% |
| 7 | BP | 341 | 0,85% |
| 8 | ÖDP | 628 | 1,57% |
| 9 | PIRATEN | 138 | 0,35% |
| 10 | AfD | 2.970 | 7,44% |
| 11 | LKR | 12 | 0,03% |
| 12 | mut | 58 | 0,15% |
| 13 | Die PARTEI | 220 | 0,55% |
| 14 | V-Partei³ | 168 | 0,42% |
- Stand: 22.10.2018 16:27:18