OK.Wahl
Internetpräsentation
Version 2.2.12
Ergebnis zur Landtagswahl 2018 am 14.10.2018
Stimmkreis Lindau - Sonthofen - Landkreis Lindau (Bodensee) - Gemeinde Stiefenhofen
Es wurden alle Stimmbezirke ausgewertet.
 Diagramm
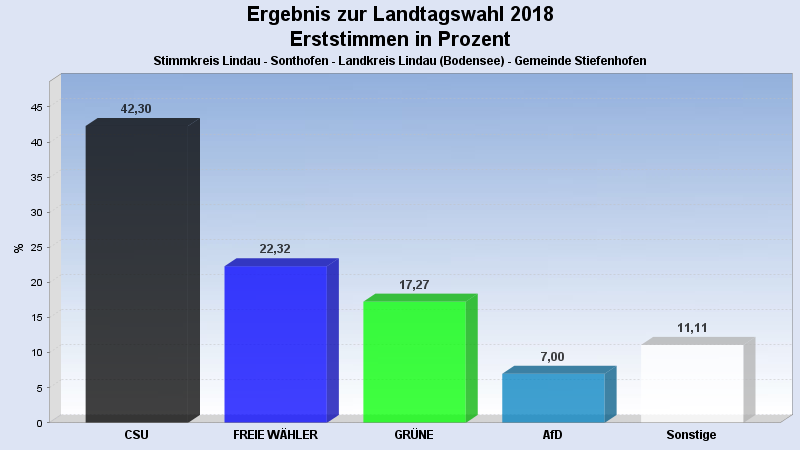
 Seitenanfang
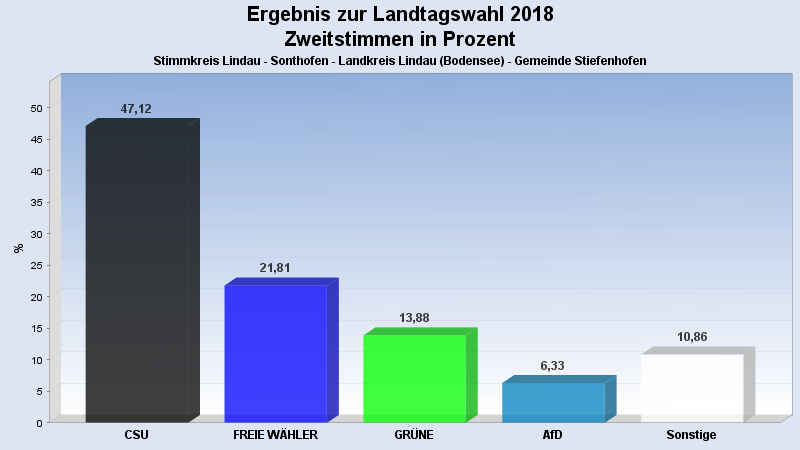
Wahlbeteiligung, Stimmzettel, Stimmen
| Wahlbeteiligung: | 75,45% |
|---|---|
| Stimmberechtigte: | 1.430 |
| Wähler: | 1.079 |
| Ungültige Erststimmen: | 8 |
| Gültige Erststimmen: | 1.071 |
| Ungültige Zweitstimmen: | 20 |
| Gültige Zweitstimmen: | 1.059 |
Erststimmen nach Wahlvorschlag
| Partei | Erststimmen | Prozent | |
|---|---|---|---|
| 1 | Beißwenger, Eric (CSU) | 453 | 42,30% |
| 2 | Maffenbeier, Michael (SPD) | 32 | 2,99% |
| 3 | Dr. Herz, Leopold (FREIE WÄHLER) | 239 | 22,32% |
| 4 | Gehring, Thomas (GRÜNE) | 185 | 17,27% |
| 5 | Dr. Spitzer, Dominik (FDP) | 36 | 3,36% |
| 6 | Schlotter, Michael (DIE LINKE) | 8 | 0,75% |
| 7 | Leising, Otto (BP) | 18 | 1,68% |
| 8 | Finger, Michael (ÖDP) | 19 | 1,77% |
| 10 | Keib, Axel (AfD) | 75 | 7,00% |
| 12 | Hüntemann, Matthias (mut) | 4 | 0,37% |
| 14 | Herzog, Stefan (V-Partei³) | 2 | 0,19% |
Zweitstimmen nach Wahlvorschlag
| Partei | Zweitstimmen | Prozent | |
|---|---|---|---|
| 1 | CSU | 499 | 47,12% |
| 2 | SPD | 31 | 2,93% |
| 3 | FREIE WÄHLER | 231 | 21,81% |
| 4 | GRÜNE | 147 | 13,88% |
| 5 | FDP | 25 | 2,36% |
| 6 | DIE LINKE | 13 | 1,23% |
| 7 | BP | 17 | 1,61% |
| 8 | ÖDP | 18 | 1,70% |
| 9 | PIRATEN | 3 | 0,28% |
| 10 | AfD | 67 | 6,33% |
| 11 | LKR | 0 | 0,00% |
| 12 | mut | 3 | 0,28% |
| 13 | Die PARTEI | 2 | 0,19% |
| 14 | V-Partei³ | 3 | 0,28% |
- Stand: 22.10.2018 16:29:27