OK.Wahl
Internetpräsentation
Version 2.2.12
Ergebnis zur Landtagswahl 2018 am 14.10.2018
Stimmkreis Lindau - Sonthofen - Landkreis Oberallgäu - Gemeinde Blaichach
Es wurden alle Stimmbezirke ausgewertet.
 Diagramm
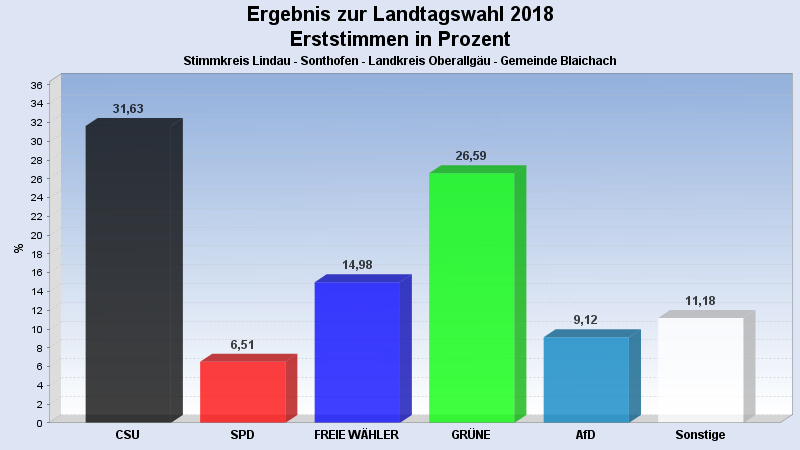
 Seitenanfang
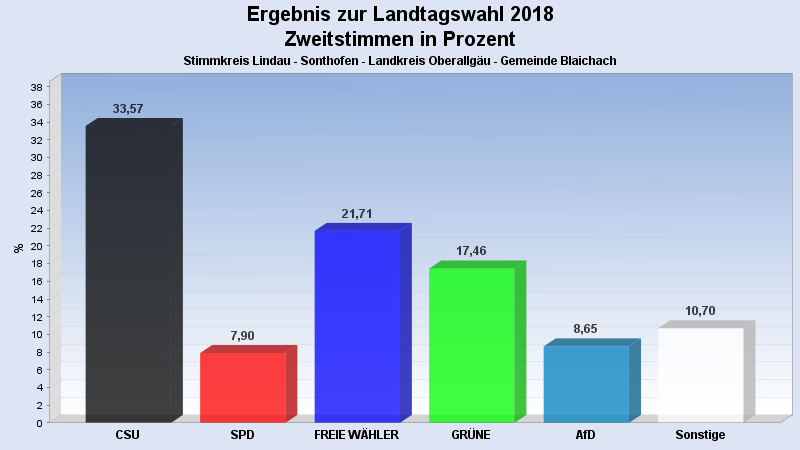
Wahlbeteiligung, Stimmzettel, Stimmen
| Wahlbeteiligung: | 74,84% |
|---|---|
| Stimmberechtigte: | 4.333 |
| Wähler: | 3.243 |
| Ungültige Erststimmen: | 31 |
| Gültige Erststimmen: | 3.212 |
| Ungültige Zweitstimmen: | 65 |
| Gültige Zweitstimmen: | 3.178 |
Erststimmen nach Wahlvorschlag
| Partei | Erststimmen | Prozent | |
|---|---|---|---|
| 1 | Beißwenger, Eric (CSU) | 1.016 | 31,63% |
| 2 | Maffenbeier, Michael (SPD) | 209 | 6,51% |
| 3 | Dr. Herz, Leopold (FREIE WÄHLER) | 481 | 14,98% |
| 4 | Gehring, Thomas (GRÜNE) | 854 | 26,59% |
| 5 | Dr. Spitzer, Dominik (FDP) | 153 | 4,76% |
| 6 | Schlotter, Michael (DIE LINKE) | 80 | 2,49% |
| 7 | Leising, Otto (BP) | 68 | 2,12% |
| 8 | Finger, Michael (ÖDP) | 30 | 0,93% |
| 10 | Keib, Axel (AfD) | 293 | 9,12% |
| 12 | Hüntemann, Matthias (mut) | 17 | 0,53% |
| 14 | Herzog, Stefan (V-Partei³) | 11 | 0,34% |
Zweitstimmen nach Wahlvorschlag
| Partei | Zweitstimmen | Prozent | |
|---|---|---|---|
| 1 | CSU | 1.067 | 33,57% |
| 2 | SPD | 251 | 7,90% |
| 3 | FREIE WÄHLER | 690 | 21,71% |
| 4 | GRÜNE | 555 | 17,46% |
| 5 | FDP | 128 | 4,03% |
| 6 | DIE LINKE | 66 | 2,08% |
| 7 | BP | 59 | 1,86% |
| 8 | ÖDP | 19 | 0,60% |
| 9 | PIRATEN | 12 | 0,38% |
| 10 | AfD | 275 | 8,65% |
| 11 | LKR | 4 | 0,13% |
| 12 | mut | 12 | 0,38% |
| 13 | Die PARTEI | 31 | 0,98% |
| 14 | V-Partei³ | 9 | 0,28% |
- Stand: 22.10.2018 16:30:16