OK.Wahl
Internetpräsentation
Version 2.2.12
Ergebnis zur Landtagswahl 2018 am 14.10.2018
Stimmkreis Lindau - Sonthofen - Landkreis Oberallgäu - Gemeinde Burgberg i. Allgäu
Es wurden alle Stimmbezirke ausgewertet.
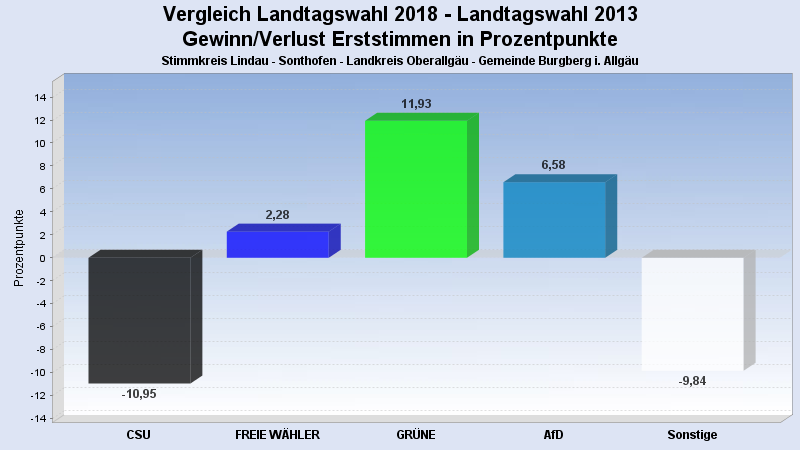
 Diagramm
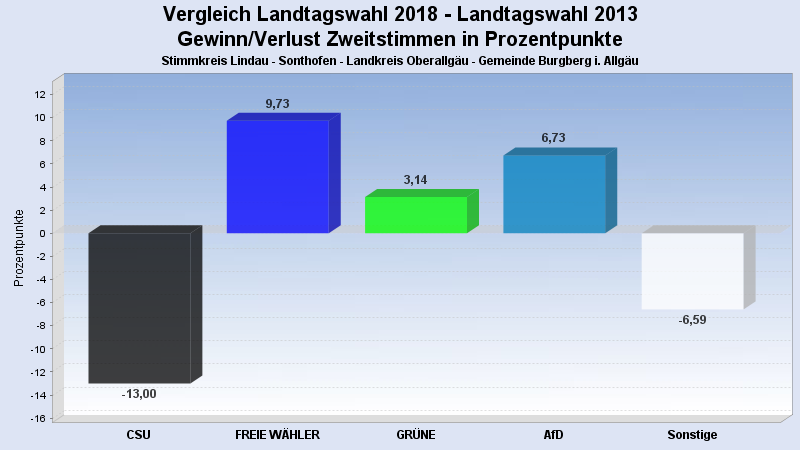
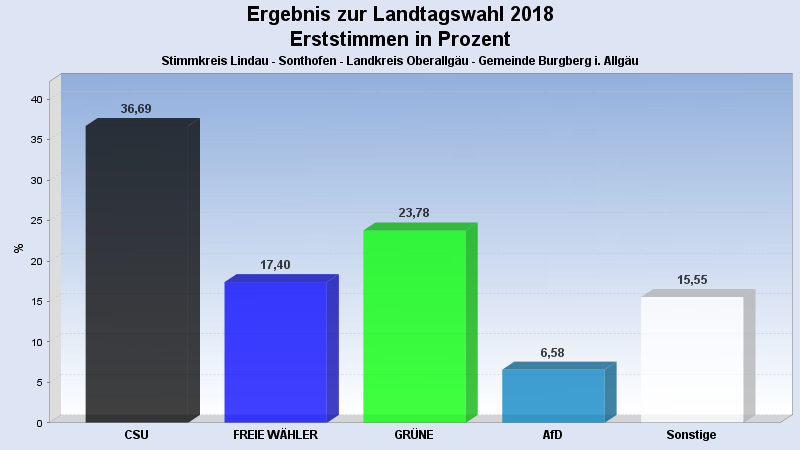
 Seitenanfang
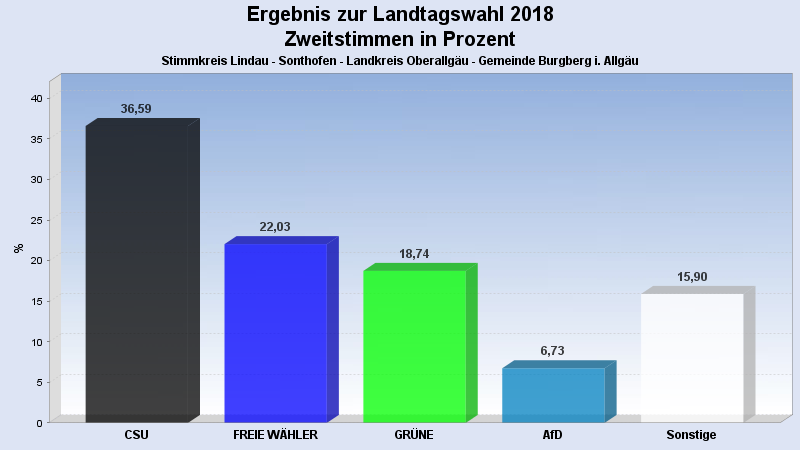
Wahlbeteiligung, Stimmzettel, Stimmen
| Wahlbeteiligung: | 78,61% |
|---|---|
| Stimmberechtigte: | 2.576 |
| Wähler: | 2.025 |
| Ungültige Erststimmen: | 19 |
| Gültige Erststimmen: | 2.006 |
| Ungültige Zweitstimmen: | 19 |
| Gültige Zweitstimmen: | 2.006 |
Erststimmen nach Wahlvorschlag
| Partei | Erststimmen | Prozent | |
|---|---|---|---|
| 1 | Beißwenger, Eric (CSU) | 736 | 36,69% |
| 2 | Maffenbeier, Michael (SPD) | 82 | 4,09% |
| 3 | Dr. Herz, Leopold (FREIE WÄHLER) | 349 | 17,40% |
| 4 | Gehring, Thomas (GRÜNE) | 477 | 23,78% |
| 5 | Dr. Spitzer, Dominik (FDP) | 98 | 4,89% |
| 6 | Schlotter, Michael (DIE LINKE) | 36 | 1,79% |
| 7 | Leising, Otto (BP) | 57 | 2,84% |
| 8 | Finger, Michael (ÖDP) | 17 | 0,85% |
| 10 | Keib, Axel (AfD) | 132 | 6,58% |
| 12 | Hüntemann, Matthias (mut) | 11 | 0,55% |
| 14 | Herzog, Stefan (V-Partei³) | 11 | 0,55% |
Zweitstimmen nach Wahlvorschlag
| Partei | Zweitstimmen | Prozent | |
|---|---|---|---|
| 1 | CSU | 734 | 36,59% |
| 2 | SPD | 91 | 4,54% |
| 3 | FREIE WÄHLER | 442 | 22,03% |
| 4 | GRÜNE | 376 | 18,74% |
| 5 | FDP | 83 | 4,14% |
| 6 | DIE LINKE | 39 | 1,94% |
| 7 | BP | 57 | 2,84% |
| 8 | ÖDP | 16 | 0,80% |
| 9 | PIRATEN | 3 | 0,15% |
| 10 | AfD | 135 | 6,73% |
| 11 | LKR | 0 | 0,00% |
| 12 | mut | 7 | 0,35% |
| 13 | Die PARTEI | 13 | 0,65% |
| 14 | V-Partei³ | 10 | 0,50% |
- Stand: 22.10.2018 16:30:31