OK.Wahl
Internetpräsentation
Version 2.2.12
Ergebnis zur Landtagswahl 2018 am 14.10.2018
Stimmkreis Lindau - Sonthofen - Landkreis Oberallgäu - Markt Bad Hindelang
Es wurden alle Stimmbezirke ausgewertet.
 Diagramm
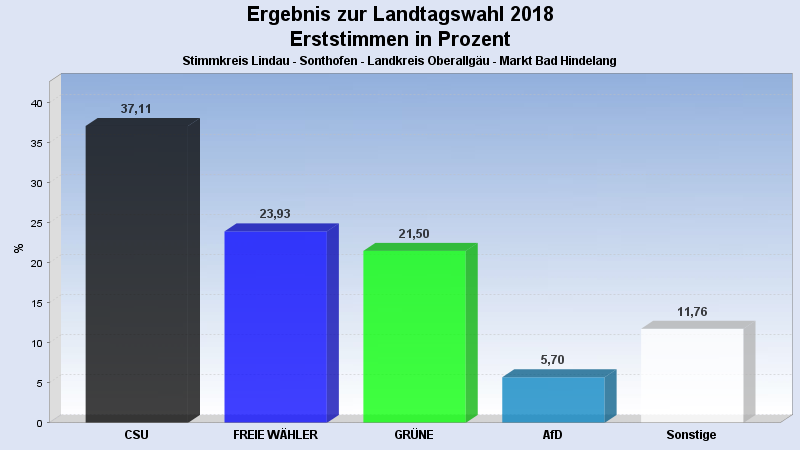
 Seitenanfang
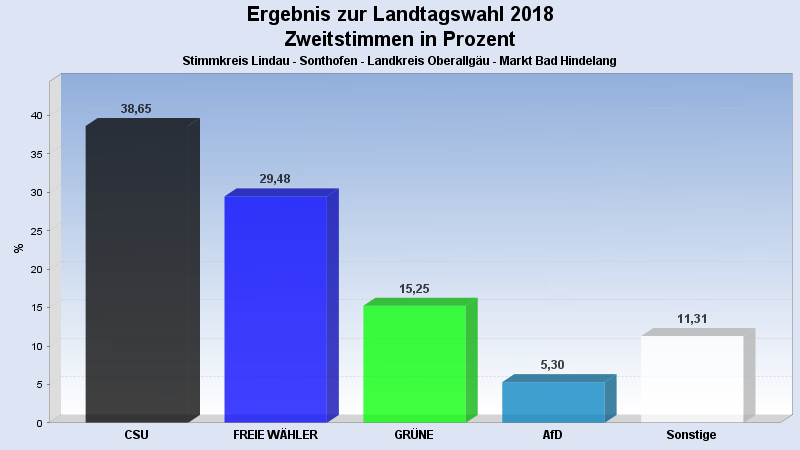
Wahlbeteiligung, Stimmzettel, Stimmen
| Wahlbeteiligung: | 77,41% |
|---|---|
| Stimmberechtigte: | 3.865 |
| Wähler: | 2.992 |
| Ungültige Erststimmen: | 24 |
| Gültige Erststimmen: | 2.967 |
| Ungültige Zweitstimmen: | 48 |
| Gültige Zweitstimmen: | 2.944 |
Erststimmen nach Wahlvorschlag
| Partei | Erststimmen | Prozent | |
|---|---|---|---|
| 1 | Beißwenger, Eric (CSU) | 1.101 | 37,11% |
| 2 | Maffenbeier, Michael (SPD) | 96 | 3,24% |
| 3 | Dr. Herz, Leopold (FREIE WÄHLER) | 710 | 23,93% |
| 4 | Gehring, Thomas (GRÜNE) | 638 | 21,50% |
| 5 | Dr. Spitzer, Dominik (FDP) | 108 | 3,64% |
| 6 | Schlotter, Michael (DIE LINKE) | 42 | 1,42% |
| 7 | Leising, Otto (BP) | 58 | 1,95% |
| 8 | Finger, Michael (ÖDP) | 25 | 0,84% |
| 10 | Keib, Axel (AfD) | 169 | 5,70% |
| 12 | Hüntemann, Matthias (mut) | 11 | 0,37% |
| 14 | Herzog, Stefan (V-Partei³) | 9 | 0,30% |
Zweitstimmen nach Wahlvorschlag
| Partei | Zweitstimmen | Prozent | |
|---|---|---|---|
| 1 | CSU | 1.138 | 38,65% |
| 2 | SPD | 110 | 3,74% |
| 3 | FREIE WÄHLER | 868 | 29,48% |
| 4 | GRÜNE | 449 | 15,25% |
| 5 | FDP | 69 | 2,34% |
| 6 | DIE LINKE | 51 | 1,73% |
| 7 | BP | 53 | 1,80% |
| 8 | ÖDP | 24 | 0,82% |
| 9 | PIRATEN | 7 | 0,24% |
| 10 | AfD | 156 | 5,30% |
| 11 | LKR | 0 | 0,00% |
| 12 | mut | 5 | 0,17% |
| 13 | Die PARTEI | 8 | 0,27% |
| 14 | V-Partei³ | 6 | 0,20% |
- Stand: 22.10.2018 16:29:56