OK.Wahl
Internetpräsentation
Version 2.2.12
Ergebnis zur Landtagswahl 2018 am 14.10.2018
Stimmkreis Lindau - Sonthofen - Landkreis Oberallgäu - Stadt Immenstadt i. Allgäu
Es wurden alle Stimmbezirke ausgewertet.
 Diagramm
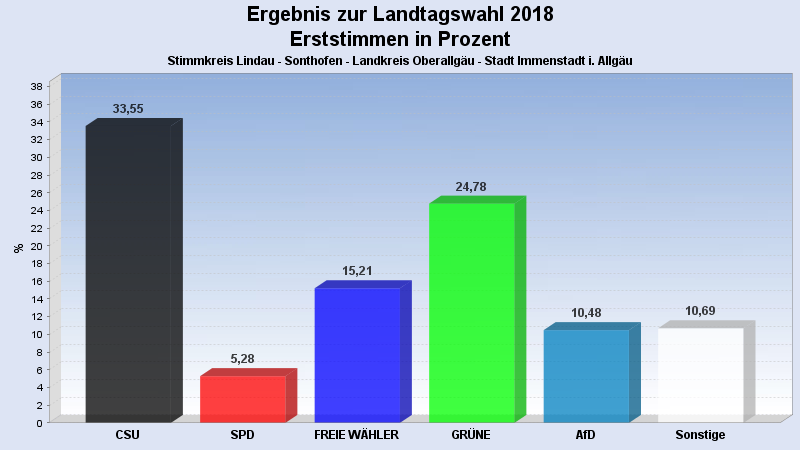
 Seitenanfang
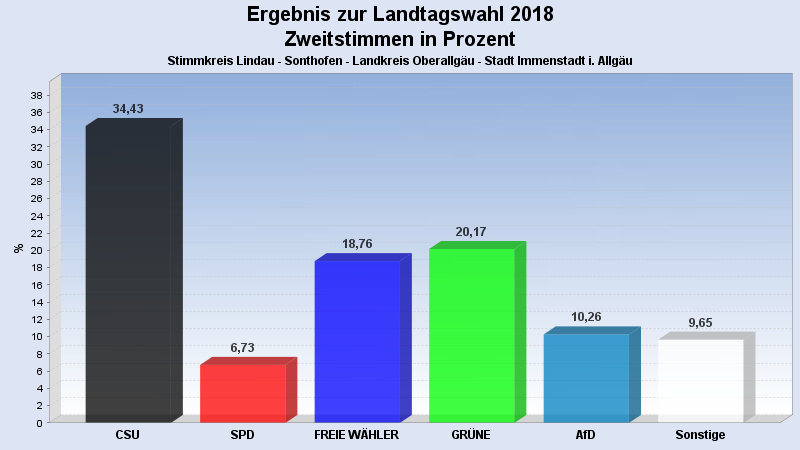
Wahlbeteiligung, Stimmzettel, Stimmen
| Wahlbeteiligung: | 68,66% |
|---|---|
| Stimmberechtigte: | 10.422 |
| Wähler: | 7.156 |
| Ungültige Erststimmen: | 75 |
| Gültige Erststimmen: | 7.081 |
| Ungültige Zweitstimmen: | 87 |
| Gültige Zweitstimmen: | 7.069 |
Erststimmen nach Wahlvorschlag
| Partei | Erststimmen | Prozent | |
|---|---|---|---|
| 1 | Beißwenger, Eric (CSU) | 2.376 | 33,55% |
| 2 | Maffenbeier, Michael (SPD) | 374 | 5,28% |
| 3 | Dr. Herz, Leopold (FREIE WÄHLER) | 1.077 | 15,21% |
| 4 | Gehring, Thomas (GRÜNE) | 1.755 | 24,78% |
| 5 | Dr. Spitzer, Dominik (FDP) | 349 | 4,93% |
| 6 | Schlotter, Michael (DIE LINKE) | 174 | 2,46% |
| 7 | Leising, Otto (BP) | 97 | 1,37% |
| 8 | Finger, Michael (ÖDP) | 82 | 1,16% |
| 10 | Keib, Axel (AfD) | 742 | 10,48% |
| 12 | Hüntemann, Matthias (mut) | 23 | 0,32% |
| 14 | Herzog, Stefan (V-Partei³) | 32 | 0,45% |
Zweitstimmen nach Wahlvorschlag
| Partei | Zweitstimmen | Prozent | |
|---|---|---|---|
| 1 | CSU | 2.434 | 34,43% |
| 2 | SPD | 476 | 6,73% |
| 3 | FREIE WÄHLER | 1.326 | 18,76% |
| 4 | GRÜNE | 1.426 | 20,17% |
| 5 | FDP | 243 | 3,44% |
| 6 | DIE LINKE | 167 | 2,36% |
| 7 | BP | 90 | 1,27% |
| 8 | ÖDP | 74 | 1,05% |
| 9 | PIRATEN | 26 | 0,37% |
| 10 | AfD | 725 | 10,26% |
| 11 | LKR | 5 | 0,07% |
| 12 | mut | 9 | 0,13% |
| 13 | Die PARTEI | 43 | 0,61% |
| 14 | V-Partei³ | 25 | 0,35% |
- Stand: 22.10.2018 16:30:45