OK.Wahl
Internetpräsentation
Version 2.2.12
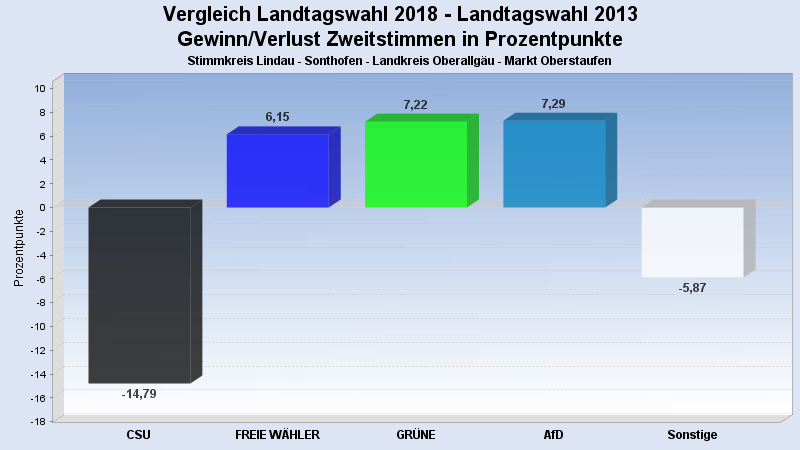
Ergebnis zur Landtagswahl 2018 am 14.10.2018
Stimmkreis Lindau - Sonthofen - Landkreis Oberallgäu - Markt Oberstaufen
Es wurden alle Stimmbezirke ausgewertet.
 Diagramm
 Seitenanfang

Wahlbeteiligung, Stimmzettel, Stimmen
| Wahlbeteiligung: | 71,29% |
|---|---|
| Stimmberechtigte: | 5.622 |
| Wähler: | 4.008 |
| Ungültige Erststimmen: | 23 |
| Gültige Erststimmen: | 3.985 |
| Ungültige Zweitstimmen: | 54 |
| Gültige Zweitstimmen: | 3.953 |
Erststimmen nach Wahlvorschlag
| Partei | Erststimmen | Prozent | |
|---|---|---|---|
| 1 | Beißwenger, Eric (CSU) | 1.676 | 42,06% |
| 2 | Maffenbeier, Michael (SPD) | 133 | 3,34% |
| 3 | Dr. Herz, Leopold (FREIE WÄHLER) | 769 | 19,30% |
| 4 | Gehring, Thomas (GRÜNE) | 712 | 17,87% |
| 5 | Dr. Spitzer, Dominik (FDP) | 185 | 4,64% |
| 6 | Schlotter, Michael (DIE LINKE) | 81 | 2,03% |
| 7 | Leising, Otto (BP) | 44 | 1,10% |
| 8 | Finger, Michael (ÖDP) | 46 | 1,15% |
| 10 | Keib, Axel (AfD) | 316 | 7,93% |
| 12 | Hüntemann, Matthias (mut) | 5 | 0,13% |
| 14 | Herzog, Stefan (V-Partei³) | 18 | 0,45% |
Zweitstimmen nach Wahlvorschlag
| Partei | Zweitstimmen | Prozent | |
|---|---|---|---|
| 1 | CSU | 1.651 | 41,77% |
| 2 | SPD | 134 | 3,39% |
| 3 | FREIE WÄHLER | 894 | 22,62% |
| 4 | GRÜNE | 607 | 15,36% |
| 5 | FDP | 162 | 4,10% |
| 6 | DIE LINKE | 80 | 2,02% |
| 7 | BP | 50 | 1,26% |
| 8 | ÖDP | 39 | 0,99% |
| 9 | PIRATEN | 4 | 0,10% |
| 10 | AfD | 288 | 7,29% |
| 11 | LKR | 0 | 0,00% |
| 12 | mut | 7 | 0,18% |
| 13 | Die PARTEI | 17 | 0,43% |
| 14 | V-Partei³ | 20 | 0,51% |
- Stand: 22.10.2018 16:31:34