OK.Wahl
Internetpräsentation
Version 2.2.12
Ergebnis zur Landtagswahl 2018 am 14.10.2018
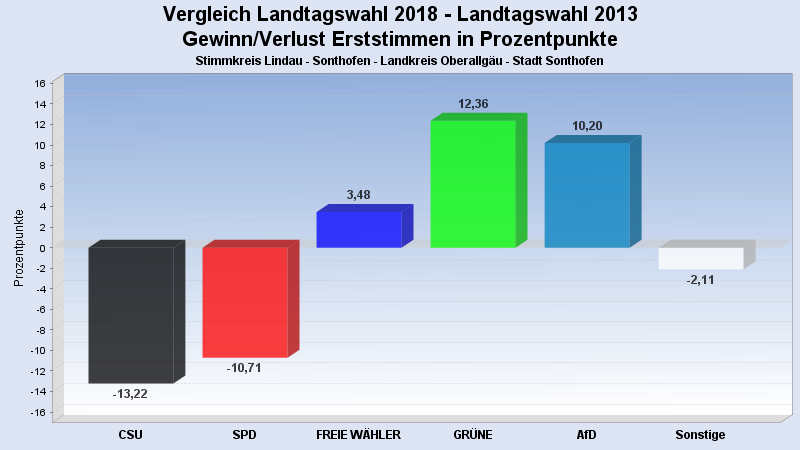
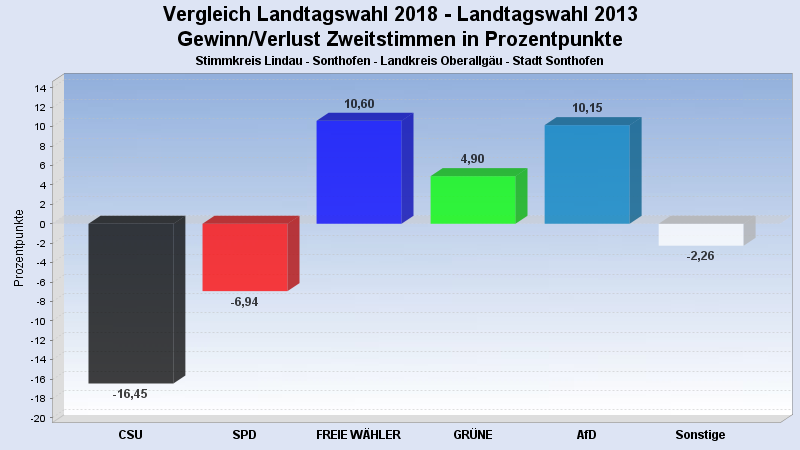
Stimmkreis Lindau - Sonthofen - Landkreis Oberallgäu - Stadt Sonthofen
Es wurden alle Stimmbezirke ausgewertet.
 Diagramm
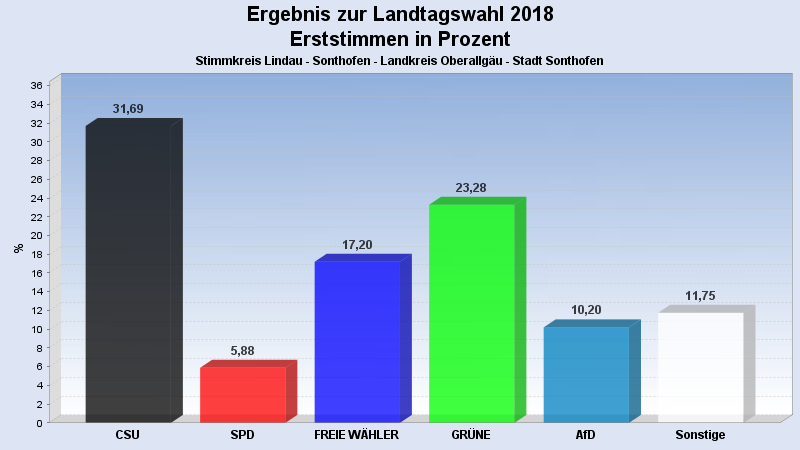
 Seitenanfang
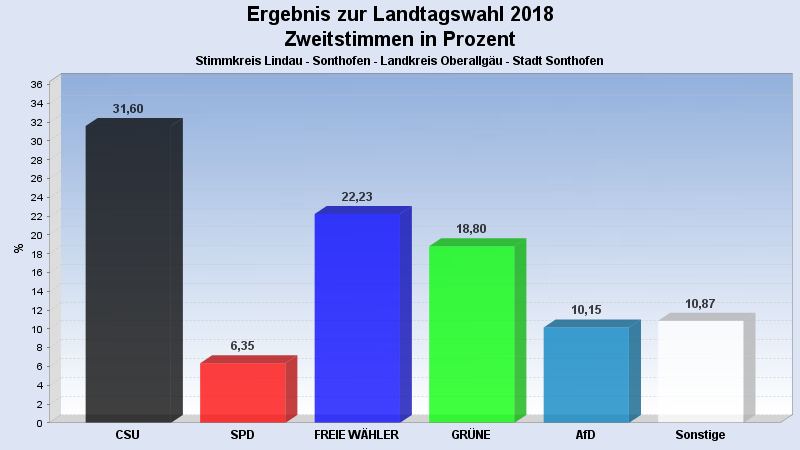
Wahlbeteiligung, Stimmzettel, Stimmen
| Wahlbeteiligung: | 68,29% |
|---|---|
| Stimmberechtigte: | 16.535 |
| Wähler: | 11.292 |
| Ungültige Erststimmen: | 82 |
| Gültige Erststimmen: | 11.209 |
| Ungültige Zweitstimmen: | 160 |
| Gültige Zweitstimmen: | 11.131 |
Erststimmen nach Wahlvorschlag
| Partei | Erststimmen | Prozent | |
|---|---|---|---|
| 1 | Beißwenger, Eric (CSU) | 3.552 | 31,69% |
| 2 | Maffenbeier, Michael (SPD) | 659 | 5,88% |
| 3 | Dr. Herz, Leopold (FREIE WÄHLER) | 1.928 | 17,20% |
| 4 | Gehring, Thomas (GRÜNE) | 2.610 | 23,28% |
| 5 | Dr. Spitzer, Dominik (FDP) | 558 | 4,98% |
| 6 | Schlotter, Michael (DIE LINKE) | 307 | 2,74% |
| 7 | Leising, Otto (BP) | 201 | 1,79% |
| 8 | Finger, Michael (ÖDP) | 141 | 1,26% |
| 10 | Keib, Axel (AfD) | 1.143 | 10,20% |
| 12 | Hüntemann, Matthias (mut) | 66 | 0,59% |
| 14 | Herzog, Stefan (V-Partei³) | 44 | 0,39% |
Zweitstimmen nach Wahlvorschlag
| Partei | Zweitstimmen | Prozent | |
|---|---|---|---|
| 1 | CSU | 3.517 | 31,60% |
| 2 | SPD | 707 | 6,35% |
| 3 | FREIE WÄHLER | 2.474 | 22,23% |
| 4 | GRÜNE | 2.093 | 18,80% |
| 5 | FDP | 471 | 4,23% |
| 6 | DIE LINKE | 304 | 2,73% |
| 7 | BP | 154 | 1,38% |
| 8 | ÖDP | 103 | 0,93% |
| 9 | PIRATEN | 38 | 0,34% |
| 10 | AfD | 1.130 | 10,15% |
| 11 | LKR | 1 | 0,01% |
| 12 | mut | 33 | 0,30% |
| 13 | Die PARTEI | 55 | 0,49% |
| 14 | V-Partei³ | 51 | 0,46% |
- Stand: 22.10.2018 16:32:27