OK.Wahl
Internetpräsentation
Version 2.2.12
Ergebnis zur Bundestagswahl 2017 am 24.09.2017
Wahlkreis Oberallgäu - Landkreis Lindau (Bodensee) - Gemeinde Scheidegg
Es wurden alle Wahlbezirke ausgewertet.
 Diagramm
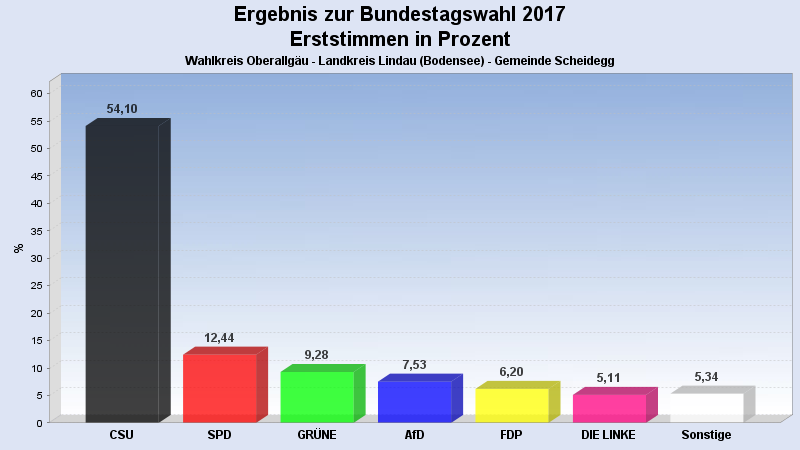
 Seitenanfang
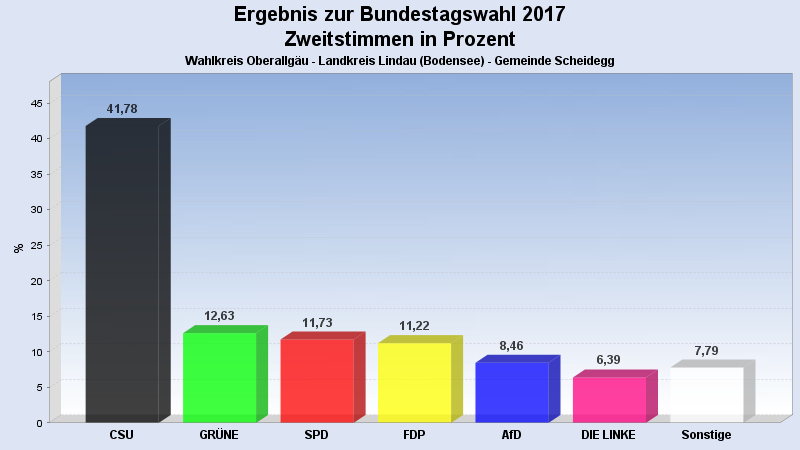
Wahlbeteiligung, Stimmzettel, Stimmen
| Wahlbeteiligung: | 80,51% |
|---|---|
| Wahlberechtigte: | 3.212 |
| Wähler: | 2.586 |
| Ungültige Erststimmen: | 22 |
| Gültige Erststimmen: | 2.564 |
| Ungültige Zweitstimmen: | 20 |
| Gültige Zweitstimmen: | 2.566 |
Erststimmen nach Wahlvorschlag
| Partei | Erststimmen | Prozent | |
|---|---|---|---|
| 1 | Dr. Müller, Gerd (CSU) | 1.387 | 54,10% |
| 2 | Schrader, Katharina (SPD) | 319 | 12,44% |
| 3 | Groll, Erna-Kathrein (GRÜNE) | 238 | 9,28% |
| 5 | Felser, Peter (AfD) | 193 | 7,53% |
| 4 | Thomae, Stephan (FDP) | 159 | 6,20% |
| 6 | Merk, Franz Xaver (DIE LINKE) | 131 | 5,11% |
| 7 | Wirthensohn, Hugo Michael (FREIE WÄHLER) | 75 | 2,93% |
| 9 | Fischer, Lucia Maria (ÖDP) | 50 | 1,95% |
| 10 | Dr. Kirchmann, Josef Anton (BP) | 12 | 0,47% |
Zweitstimmen nach Wahlvorschlag
| Partei | Zweitstimmen | Prozent | |
|---|---|---|---|
| 1 | CSU | 1.072 | 41,78% |
| 3 | GRÜNE | 324 | 12,63% |
| 2 | SPD | 301 | 11,73% |
| 4 | FDP | 288 | 11,22% |
| 5 | AfD | 217 | 8,46% |
| 6 | DIE LINKE | 164 | 6,39% |
| 7 | FREIE WÄHLER | 67 | 2,61% |
| 9 | ÖDP | 46 | 1,79% |
| 12 | Tierschutzpartei | 24 | 0,94% |
| 10 | BP | 20 | 0,78% |
| 15 | BGE | 9 | 0,35% |
| 8 | PIRATEN | 6 | 0,23% |
| 19 | Die PARTEI | 6 | 0,23% |
| 11 | NPD | 5 | 0,19% |
| 16 | DiB | 5 | 0,19% |
| 18 | DM | 5 | 0,19% |
| 20 | Gesundheitsforschung | 3 | 0,12% |
| 21 | V-Partei³ | 2 | 0,08% |
| 13 | MLPD | 1 | 0,04% |
| 14 | BüSo | 1 | 0,04% |
| 17 | DKP | 0 | 0,00% |
- Stand: 29.09.2017 10:44:32