OK.Wahl
Internetpräsentation
Version 2.2.12
Ergebnis zur Bundestagswahl 2017 am 24.09.2017
Wahlkreis Oberallgäu - Landkreis Lindau (Bodensee) - Gemeinde Weiler-Simmerberg
Es wurden alle Wahlbezirke ausgewertet.
 Diagramm
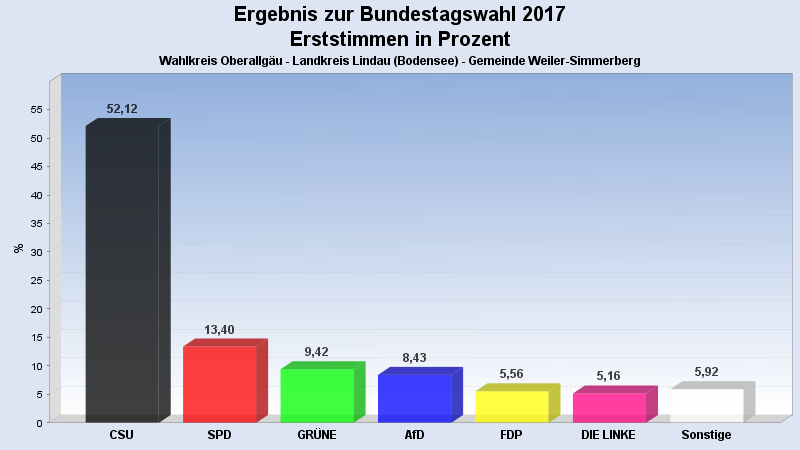
 Seitenanfang
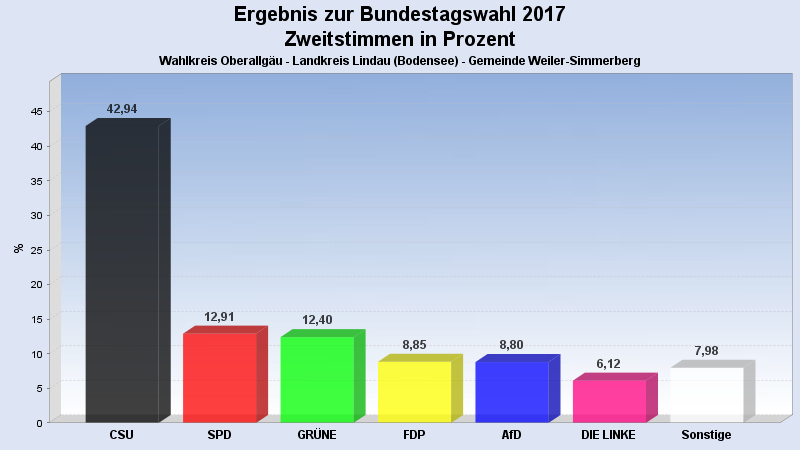
Wahlbeteiligung, Stimmzettel, Stimmen
| Wahlbeteiligung: | 76,67% |
|---|---|
| Wahlberechtigte: | 4.654 |
| Wähler: | 3.568 |
| Ungültige Erststimmen: | 22 |
| Gültige Erststimmen: | 3.546 |
| Ungültige Zweitstimmen: | 21 |
| Gültige Zweitstimmen: | 3.547 |
Erststimmen nach Wahlvorschlag
| Partei | Erststimmen | Prozent | |
|---|---|---|---|
| 1 | Dr. Müller, Gerd (CSU) | 1.848 | 52,12% |
| 2 | Schrader, Katharina (SPD) | 475 | 13,40% |
| 3 | Groll, Erna-Kathrein (GRÜNE) | 334 | 9,42% |
| 5 | Felser, Peter (AfD) | 299 | 8,43% |
| 4 | Thomae, Stephan (FDP) | 197 | 5,56% |
| 6 | Merk, Franz Xaver (DIE LINKE) | 183 | 5,16% |
| 7 | Wirthensohn, Hugo Michael (FREIE WÄHLER) | 145 | 4,09% |
| 9 | Fischer, Lucia Maria (ÖDP) | 33 | 0,93% |
| 10 | Dr. Kirchmann, Josef Anton (BP) | 32 | 0,90% |
Zweitstimmen nach Wahlvorschlag
| Partei | Zweitstimmen | Prozent | |
|---|---|---|---|
| 1 | CSU | 1.523 | 42,94% |
| 2 | SPD | 458 | 12,91% |
| 3 | GRÜNE | 440 | 12,40% |
| 4 | FDP | 314 | 8,85% |
| 5 | AfD | 312 | 8,80% |
| 6 | DIE LINKE | 217 | 6,12% |
| 7 | FREIE WÄHLER | 117 | 3,30% |
| 12 | Tierschutzpartei | 36 | 1,01% |
| 9 | ÖDP | 33 | 0,93% |
| 10 | BP | 27 | 0,76% |
| 19 | Die PARTEI | 26 | 0,73% |
| 8 | PIRATEN | 12 | 0,34% |
| 18 | DM | 7 | 0,20% |
| 11 | NPD | 6 | 0,17% |
| 15 | BGE | 6 | 0,17% |
| 20 | Gesundheitsforschung | 5 | 0,14% |
| 16 | DiB | 4 | 0,11% |
| 21 | V-Partei³ | 4 | 0,11% |
| 13 | MLPD | 0 | 0,00% |
| 14 | BüSo | 0 | 0,00% |
| 17 | DKP | 0 | 0,00% |
- Stand: 29.09.2017 10:44:56