OK.Wahl
Internetpräsentation
Version 2.2.12
Ergebnis zur Landtagswahl 2018 am 14.10.2018
Stimmkreis Lindau - Sonthofen - Landkreis Lindau (Bodensee) - Markt Heimenkirch
Es wurden alle Stimmbezirke ausgewertet.
 Diagramm
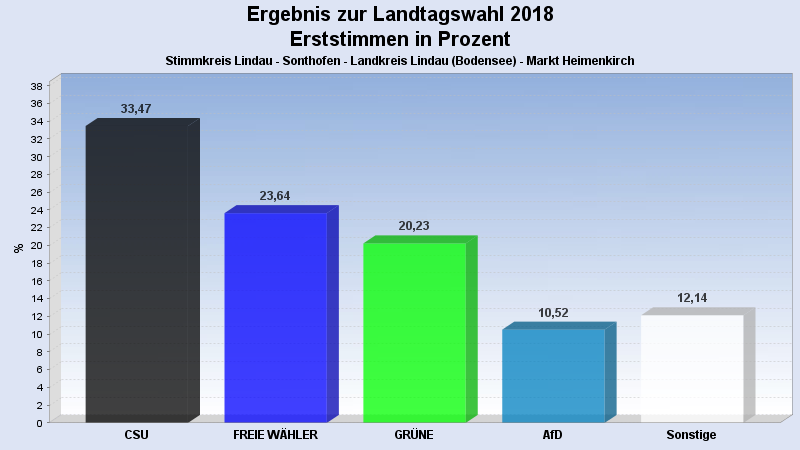
 Seitenanfang
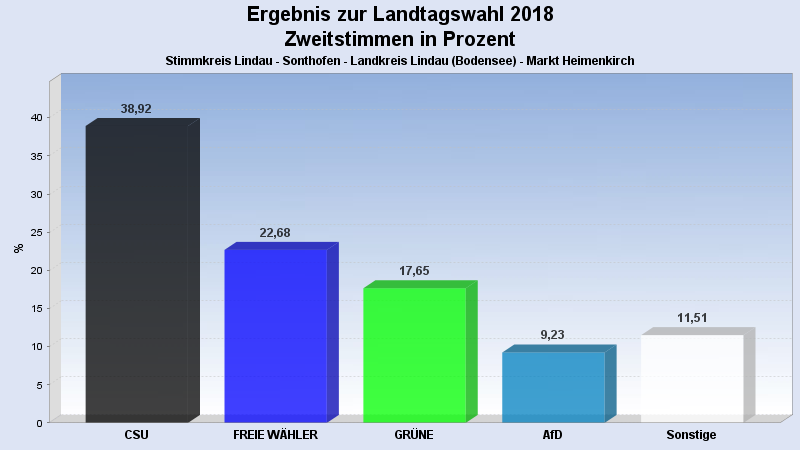
Wahlbeteiligung, Stimmzettel, Stimmen
| Wahlbeteiligung: | 66,85% |
|---|---|
| Stimmberechtigte: | 2.606 |
| Wähler: | 1.742 |
| Ungültige Erststimmen: | 12 |
| Gültige Erststimmen: | 1.730 |
| Ungültige Zweitstimmen: | 31 |
| Gültige Zweitstimmen: | 1.711 |
Erststimmen nach Wahlvorschlag
| Partei | Erststimmen | Prozent | |
|---|---|---|---|
| 1 | Beißwenger, Eric (CSU) | 579 | 33,47% |
| 2 | Maffenbeier, Michael (SPD) | 79 | 4,57% |
| 3 | Dr. Herz, Leopold (FREIE WÄHLER) | 409 | 23,64% |
| 4 | Gehring, Thomas (GRÜNE) | 350 | 20,23% |
| 5 | Dr. Spitzer, Dominik (FDP) | 52 | 3,01% |
| 6 | Schlotter, Michael (DIE LINKE) | 44 | 2,54% |
| 7 | Leising, Otto (BP) | 18 | 1,04% |
| 8 | Finger, Michael (ÖDP) | 9 | 0,52% |
| 10 | Keib, Axel (AfD) | 182 | 10,52% |
| 12 | Hüntemann, Matthias (mut) | 3 | 0,17% |
| 14 | Herzog, Stefan (V-Partei³) | 5 | 0,29% |
Zweitstimmen nach Wahlvorschlag
| Partei | Zweitstimmen | Prozent | |
|---|---|---|---|
| 1 | CSU | 666 | 38,92% |
| 2 | SPD | 70 | 4,09% |
| 3 | FREIE WÄHLER | 388 | 22,68% |
| 4 | GRÜNE | 302 | 17,65% |
| 5 | FDP | 33 | 1,93% |
| 6 | DIE LINKE | 43 | 2,51% |
| 7 | BP | 18 | 1,05% |
| 8 | ÖDP | 18 | 1,05% |
| 9 | PIRATEN | 5 | 0,29% |
| 10 | AfD | 158 | 9,23% |
| 11 | LKR | 0 | 0,00% |
| 12 | mut | 0 | 0,00% |
| 13 | Die PARTEI | 6 | 0,35% |
| 14 | V-Partei³ | 4 | 0,23% |
- Stand: 22.10.2018 16:27:33