OK.Wahl
Internetpräsentation
Version 2.2.12
Ergebnis zur Landtagswahl 2018 am 14.10.2018
Stimmkreis Lindau - Sonthofen - Landkreis Lindau (Bodensee) - Gemeinde Hergensweiler
Es wurden alle Stimmbezirke ausgewertet.
 Diagramm
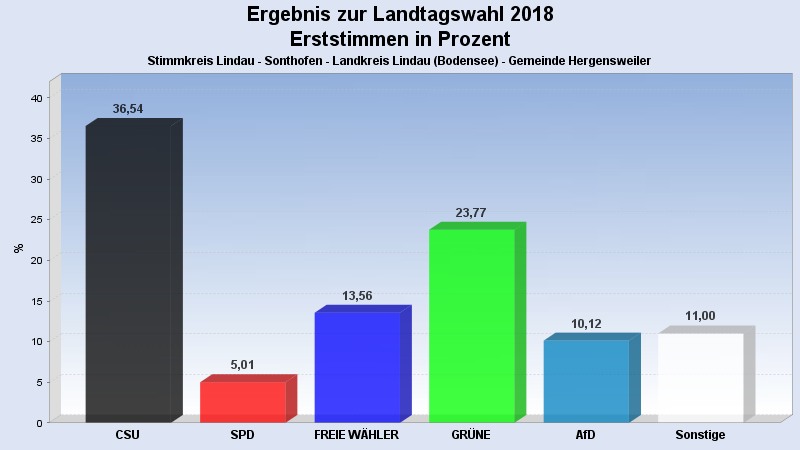
 Seitenanfang
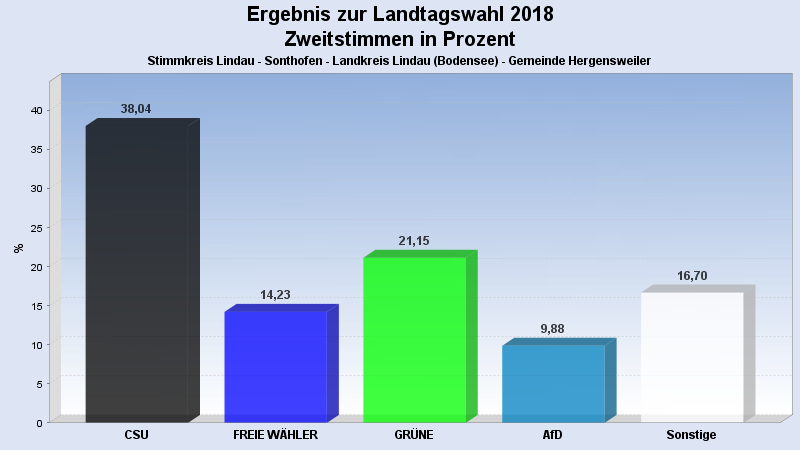
Wahlbeteiligung, Stimmzettel, Stimmen
| Wahlbeteiligung: | 72,04% |
|---|---|
| Stimmberechtigte: | 1.427 |
| Wähler: | 1.028 |
| Ungültige Erststimmen: | 10 |
| Gültige Erststimmen: | 1.018 |
| Ungültige Zweitstimmen: | 16 |
| Gültige Zweitstimmen: | 1.012 |
Erststimmen nach Wahlvorschlag
| Partei | Erststimmen | Prozent | |
|---|---|---|---|
| 1 | Beißwenger, Eric (CSU) | 372 | 36,54% |
| 2 | Maffenbeier, Michael (SPD) | 51 | 5,01% |
| 3 | Dr. Herz, Leopold (FREIE WÄHLER) | 138 | 13,56% |
| 4 | Gehring, Thomas (GRÜNE) | 242 | 23,77% |
| 5 | Dr. Spitzer, Dominik (FDP) | 49 | 4,81% |
| 6 | Schlotter, Michael (DIE LINKE) | 34 | 3,34% |
| 7 | Leising, Otto (BP) | 10 | 0,98% |
| 8 | Finger, Michael (ÖDP) | 10 | 0,98% |
| 10 | Keib, Axel (AfD) | 103 | 10,12% |
| 12 | Hüntemann, Matthias (mut) | 2 | 0,20% |
| 14 | Herzog, Stefan (V-Partei³) | 7 | 0,69% |
Zweitstimmen nach Wahlvorschlag
| Partei | Zweitstimmen | Prozent | |
|---|---|---|---|
| 1 | CSU | 385 | 38,04% |
| 2 | SPD | 49 | 4,84% |
| 3 | FREIE WÄHLER | 144 | 14,23% |
| 4 | GRÜNE | 214 | 21,15% |
| 5 | FDP | 36 | 3,56% |
| 6 | DIE LINKE | 40 | 3,95% |
| 7 | BP | 9 | 0,89% |
| 8 | ÖDP | 19 | 1,88% |
| 9 | PIRATEN | 2 | 0,20% |
| 10 | AfD | 100 | 9,88% |
| 11 | LKR | 0 | 0,00% |
| 12 | mut | 1 | 0,10% |
| 13 | Die PARTEI | 7 | 0,69% |
| 14 | V-Partei³ | 6 | 0,59% |
- Stand: 22.10.2018 16:27:44