OK.Wahl
Internetpräsentation
Version 2.2.12
Ergebnis zur Landtagswahl 2018 am 14.10.2018
Stimmkreis Lindau - Sonthofen - Landkreis Lindau (Bodensee) - Stadt Lindenberg i. Allgäu
Es wurden alle Stimmbezirke ausgewertet.
 Diagramm
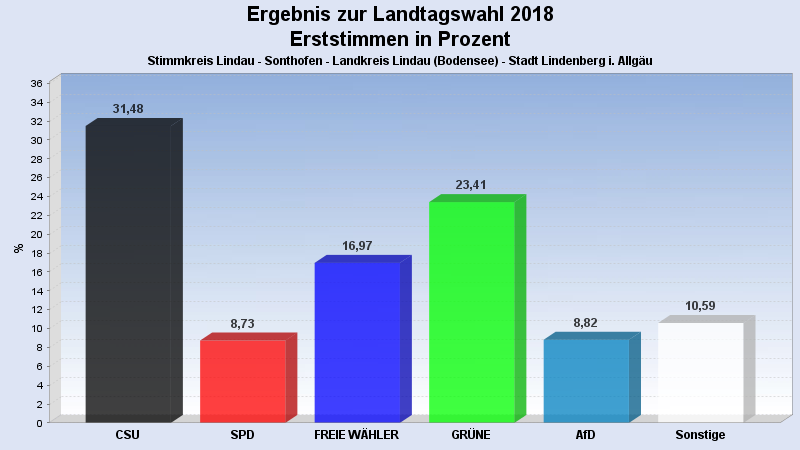
 Seitenanfang
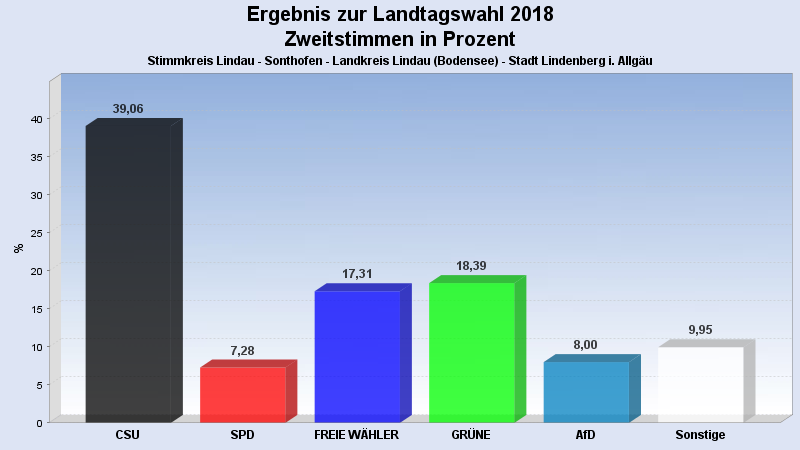
Wahlbeteiligung, Stimmzettel, Stimmen
| Wahlbeteiligung: | 64,76% |
|---|---|
| Stimmberechtigte: | 8.280 |
| Wähler: | 5.362 |
| Ungültige Erststimmen: | 57 |
| Gültige Erststimmen: | 5.305 |
| Ungültige Zweitstimmen: | 88 |
| Gültige Zweitstimmen: | 5.274 |
Erststimmen nach Wahlvorschlag
| Partei | Erststimmen | Prozent | |
|---|---|---|---|
| 1 | Beißwenger, Eric (CSU) | 1.670 | 31,48% |
| 2 | Maffenbeier, Michael (SPD) | 463 | 8,73% |
| 3 | Dr. Herz, Leopold (FREIE WÄHLER) | 900 | 16,97% |
| 4 | Gehring, Thomas (GRÜNE) | 1.242 | 23,41% |
| 5 | Dr. Spitzer, Dominik (FDP) | 255 | 4,81% |
| 6 | Schlotter, Michael (DIE LINKE) | 162 | 3,05% |
| 7 | Leising, Otto (BP) | 56 | 1,06% |
| 8 | Finger, Michael (ÖDP) | 53 | 1,00% |
| 10 | Keib, Axel (AfD) | 468 | 8,82% |
| 12 | Hüntemann, Matthias (mut) | 13 | 0,25% |
| 14 | Herzog, Stefan (V-Partei³) | 23 | 0,43% |
Zweitstimmen nach Wahlvorschlag
| Partei | Zweitstimmen | Prozent | |
|---|---|---|---|
| 1 | CSU | 2.060 | 39,06% |
| 2 | SPD | 384 | 7,28% |
| 3 | FREIE WÄHLER | 913 | 17,31% |
| 4 | GRÜNE | 970 | 18,39% |
| 5 | FDP | 152 | 2,88% |
| 6 | DIE LINKE | 193 | 3,66% |
| 7 | BP | 45 | 0,85% |
| 8 | ÖDP | 52 | 0,99% |
| 9 | PIRATEN | 30 | 0,57% |
| 10 | AfD | 422 | 8,00% |
| 11 | LKR | 1 | 0,02% |
| 12 | mut | 6 | 0,11% |
| 13 | Die PARTEI | 22 | 0,42% |
| 14 | V-Partei³ | 24 | 0,46% |
- Stand: 22.10.2018 16:28:29