OK.Wahl
Internetpräsentation
Version 2.2.12
Ergebnis zur Landtagswahl 2018 am 14.10.2018
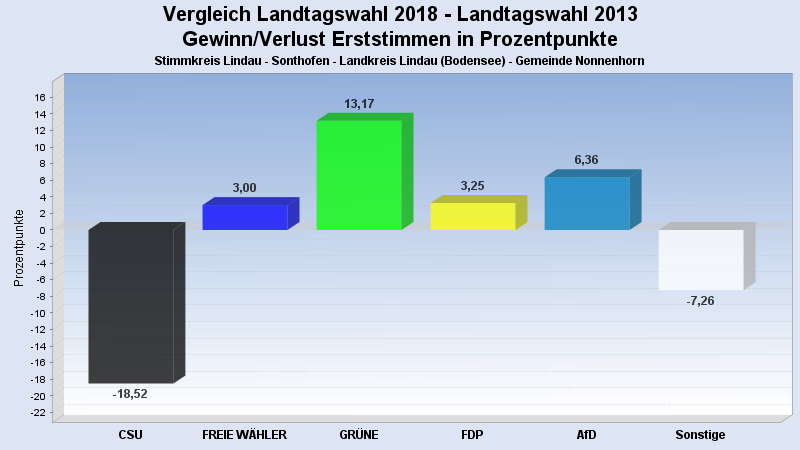
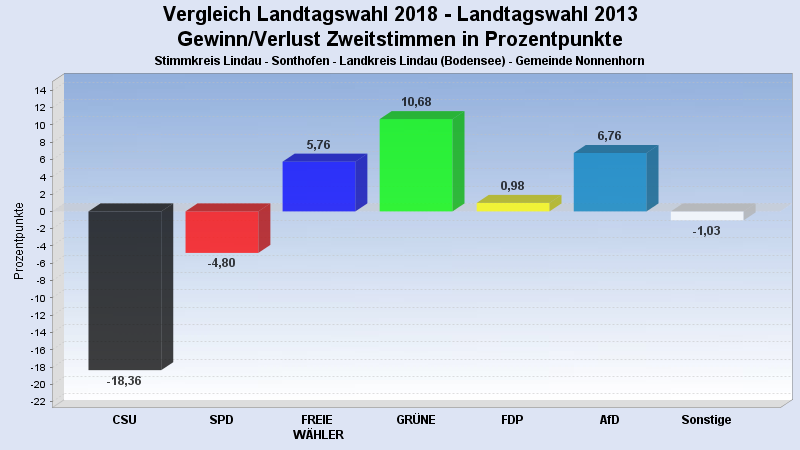
Stimmkreis Lindau - Sonthofen - Landkreis Lindau (Bodensee) - Gemeinde Nonnenhorn
Es wurden alle Stimmbezirke ausgewertet.
 Diagramm
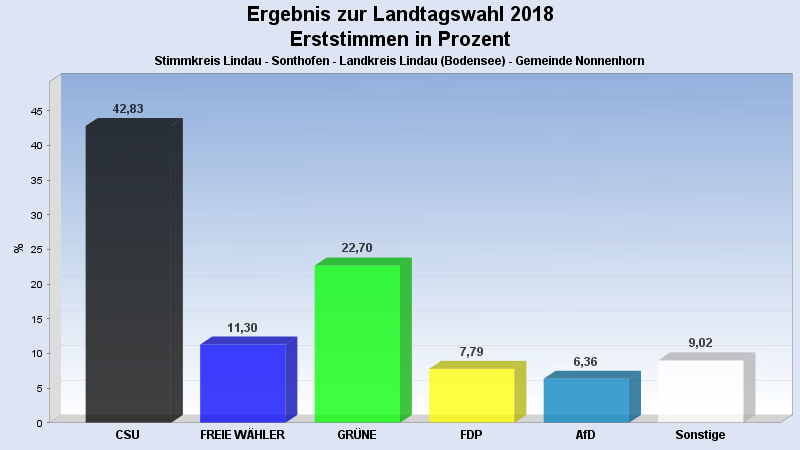
 Seitenanfang
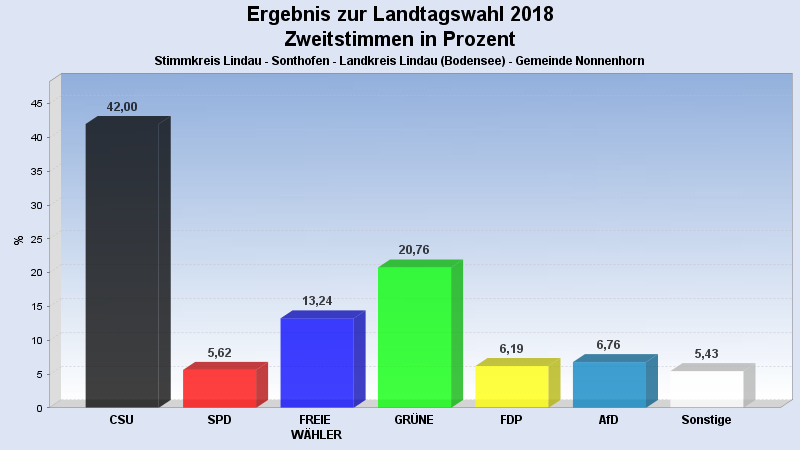
Wahlbeteiligung, Stimmzettel, Stimmen
| Wahlbeteiligung: | 78,33% |
|---|---|
| Stimmberechtigte: | 1.352 |
| Wähler: | 1.059 |
| Ungültige Erststimmen: | 6 |
| Gültige Erststimmen: | 1.053 |
| Ungültige Zweitstimmen: | 9 |
| Gültige Zweitstimmen: | 1.050 |
Erststimmen nach Wahlvorschlag
| Partei | Erststimmen | Prozent | |
|---|---|---|---|
| 1 | Beißwenger, Eric (CSU) | 451 | 42,83% |
| 2 | Maffenbeier, Michael (SPD) | 45 | 4,27% |
| 3 | Dr. Herz, Leopold (FREIE WÄHLER) | 119 | 11,30% |
| 4 | Gehring, Thomas (GRÜNE) | 239 | 22,70% |
| 5 | Dr. Spitzer, Dominik (FDP) | 82 | 7,79% |
| 6 | Schlotter, Michael (DIE LINKE) | 25 | 2,37% |
| 7 | Leising, Otto (BP) | 12 | 1,14% |
| 8 | Finger, Michael (ÖDP) | 8 | 0,76% |
| 10 | Keib, Axel (AfD) | 67 | 6,36% |
| 12 | Hüntemann, Matthias (mut) | 0 | 0,00% |
| 14 | Herzog, Stefan (V-Partei³) | 5 | 0,47% |
Zweitstimmen nach Wahlvorschlag
| Partei | Zweitstimmen | Prozent | |
|---|---|---|---|
| 1 | CSU | 441 | 42,00% |
| 2 | SPD | 59 | 5,62% |
| 3 | FREIE WÄHLER | 139 | 13,24% |
| 4 | GRÜNE | 218 | 20,76% |
| 5 | FDP | 65 | 6,19% |
| 6 | DIE LINKE | 26 | 2,48% |
| 7 | BP | 7 | 0,67% |
| 8 | ÖDP | 12 | 1,14% |
| 9 | PIRATEN | 3 | 0,29% |
| 10 | AfD | 71 | 6,76% |
| 11 | LKR | 0 | 0,00% |
| 12 | mut | 2 | 0,19% |
| 13 | Die PARTEI | 1 | 0,10% |
| 14 | V-Partei³ | 6 | 0,57% |
- Stand: 22.10.2018 16:28:50