OK.Wahl
Internetpräsentation
Version 2.2.12
Ergebnis zur Landtagswahl 2018 am 14.10.2018
Stimmkreis Lindau - Sonthofen - Landkreis Lindau (Bodensee) - Gemeinde Opfenbach
Es wurden alle Stimmbezirke ausgewertet.
 Diagramm
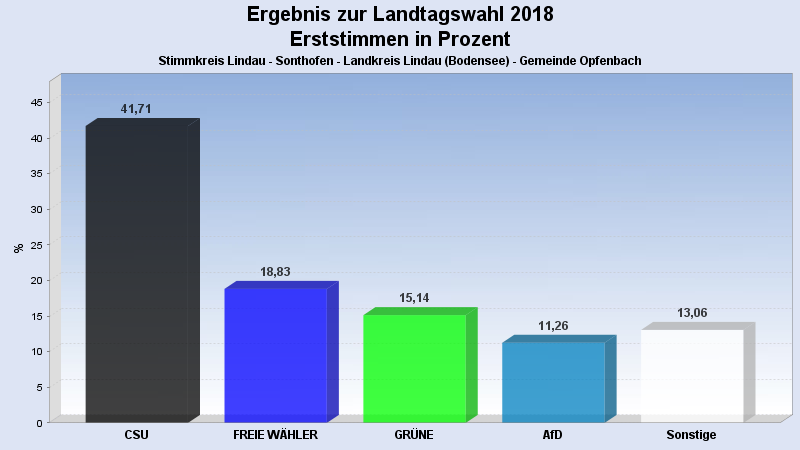
 Seitenanfang
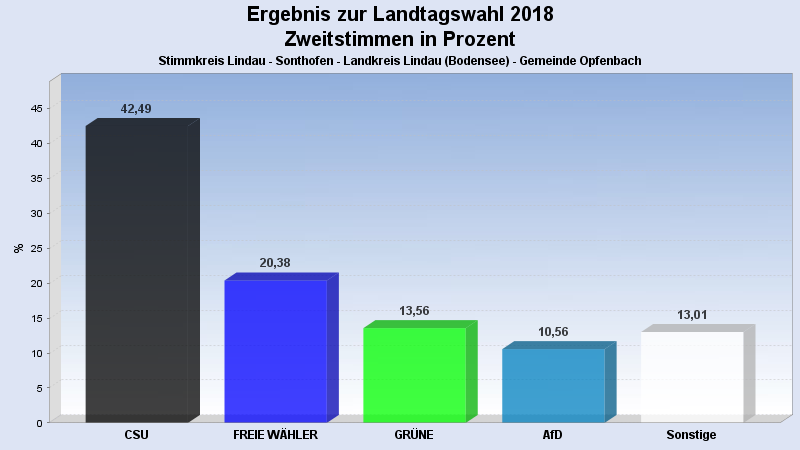
Wahlbeteiligung, Stimmzettel, Stimmen
| Wahlbeteiligung: | 68,36% |
|---|---|
| Stimmberechtigte: | 1.634 |
| Wähler: | 1.117 |
| Ungültige Erststimmen: | 7 |
| Gültige Erststimmen: | 1.110 |
| Ungültige Zweitstimmen: | 18 |
| Gültige Zweitstimmen: | 1.099 |
Erststimmen nach Wahlvorschlag
| Partei | Erststimmen | Prozent | |
|---|---|---|---|
| 1 | Beißwenger, Eric (CSU) | 463 | 41,71% |
| 2 | Maffenbeier, Michael (SPD) | 44 | 3,96% |
| 3 | Dr. Herz, Leopold (FREIE WÄHLER) | 209 | 18,83% |
| 4 | Gehring, Thomas (GRÜNE) | 168 | 15,14% |
| 5 | Dr. Spitzer, Dominik (FDP) | 46 | 4,14% |
| 6 | Schlotter, Michael (DIE LINKE) | 24 | 2,16% |
| 7 | Leising, Otto (BP) | 14 | 1,26% |
| 8 | Finger, Michael (ÖDP) | 12 | 1,08% |
| 10 | Keib, Axel (AfD) | 125 | 11,26% |
| 12 | Hüntemann, Matthias (mut) | 2 | 0,18% |
| 14 | Herzog, Stefan (V-Partei³) | 3 | 0,27% |
Zweitstimmen nach Wahlvorschlag
| Partei | Zweitstimmen | Prozent | |
|---|---|---|---|
| 1 | CSU | 467 | 42,49% |
| 2 | SPD | 51 | 4,64% |
| 3 | FREIE WÄHLER | 224 | 20,38% |
| 4 | GRÜNE | 149 | 13,56% |
| 5 | FDP | 25 | 2,27% |
| 6 | DIE LINKE | 25 | 2,27% |
| 7 | BP | 15 | 1,36% |
| 8 | ÖDP | 15 | 1,36% |
| 9 | PIRATEN | 2 | 0,18% |
| 10 | AfD | 116 | 10,56% |
| 11 | LKR | 0 | 0,00% |
| 12 | mut | 2 | 0,18% |
| 13 | Die PARTEI | 5 | 0,45% |
| 14 | V-Partei³ | 3 | 0,27% |
- Stand: 22.10.2018 16:29:01