OK.Wahl
Internetpräsentation
Version 2.2.12
Ergebnis zur Landtagswahl 2018 am 14.10.2018
Stimmkreis Lindau - Sonthofen - Landkreis Lindau (Bodensee) - Gemeinde Röthenbach(Allgäu)
Es wurden alle Stimmbezirke ausgewertet.
 Diagramm
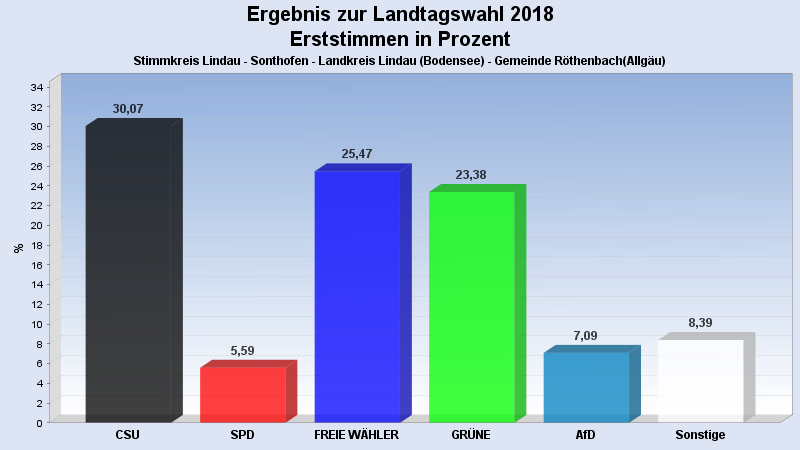
 Seitenanfang
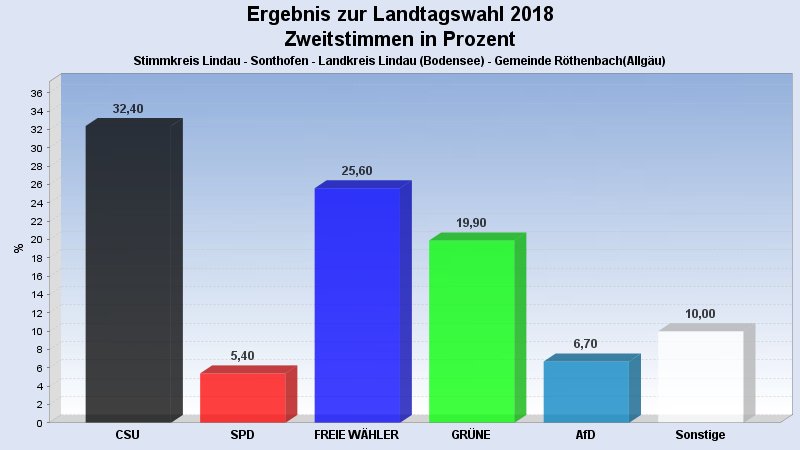
Wahlbeteiligung, Stimmzettel, Stimmen
| Wahlbeteiligung: | 71,55% |
|---|---|
| Stimmberechtigte: | 1.413 |
| Wähler: | 1.011 |
| Ungültige Erststimmen: | 10 |
| Gültige Erststimmen: | 1.001 |
| Ungültige Zweitstimmen: | 11 |
| Gültige Zweitstimmen: | 1.000 |
Erststimmen nach Wahlvorschlag
| Partei | Erststimmen | Prozent | |
|---|---|---|---|
| 1 | Beißwenger, Eric (CSU) | 301 | 30,07% |
| 2 | Maffenbeier, Michael (SPD) | 56 | 5,59% |
| 3 | Dr. Herz, Leopold (FREIE WÄHLER) | 255 | 25,47% |
| 4 | Gehring, Thomas (GRÜNE) | 234 | 23,38% |
| 5 | Dr. Spitzer, Dominik (FDP) | 26 | 2,60% |
| 6 | Schlotter, Michael (DIE LINKE) | 28 | 2,80% |
| 7 | Leising, Otto (BP) | 8 | 0,80% |
| 8 | Finger, Michael (ÖDP) | 10 | 1,00% |
| 10 | Keib, Axel (AfD) | 71 | 7,09% |
| 12 | Hüntemann, Matthias (mut) | 3 | 0,30% |
| 14 | Herzog, Stefan (V-Partei³) | 9 | 0,90% |
Zweitstimmen nach Wahlvorschlag
| Partei | Zweitstimmen | Prozent | |
|---|---|---|---|
| 1 | CSU | 324 | 32,40% |
| 2 | SPD | 54 | 5,40% |
| 3 | FREIE WÄHLER | 256 | 25,60% |
| 4 | GRÜNE | 199 | 19,90% |
| 5 | FDP | 22 | 2,20% |
| 6 | DIE LINKE | 28 | 2,80% |
| 7 | BP | 9 | 0,90% |
| 8 | ÖDP | 19 | 1,90% |
| 9 | PIRATEN | 1 | 0,10% |
| 10 | AfD | 67 | 6,70% |
| 11 | LKR | 0 | 0,00% |
| 12 | mut | 3 | 0,30% |
| 13 | Die PARTEI | 8 | 0,80% |
| 14 | V-Partei³ | 10 | 1,00% |
- Stand: 22.10.2018 16:29:05