OK.Wahl
Internetpräsentation
Version 2.2.12
Ergebnis zur Landtagswahl 2018 am 14.10.2018
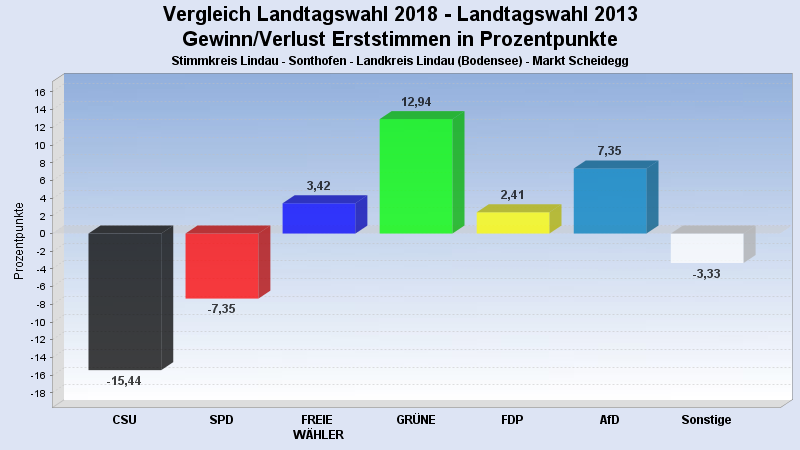
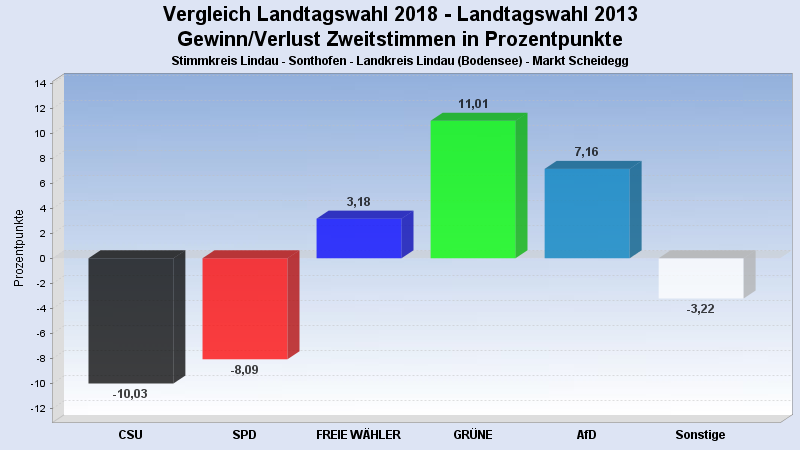
Stimmkreis Lindau - Sonthofen - Landkreis Lindau (Bodensee) - Markt Scheidegg
Es wurden alle Stimmbezirke ausgewertet.
 Diagramm
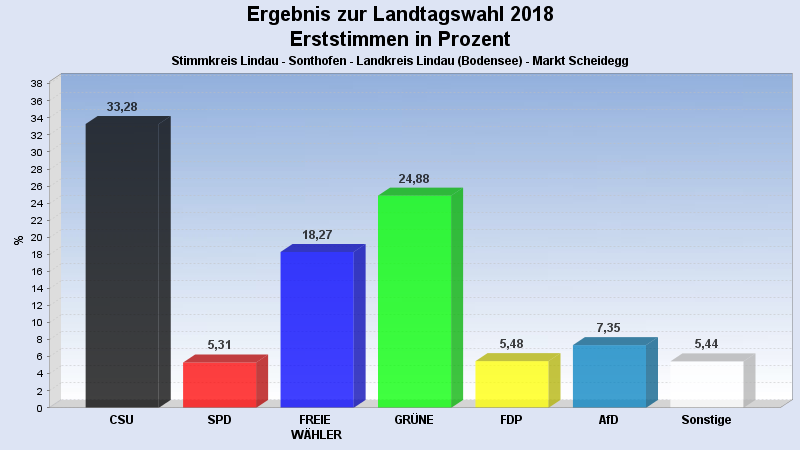
 Seitenanfang
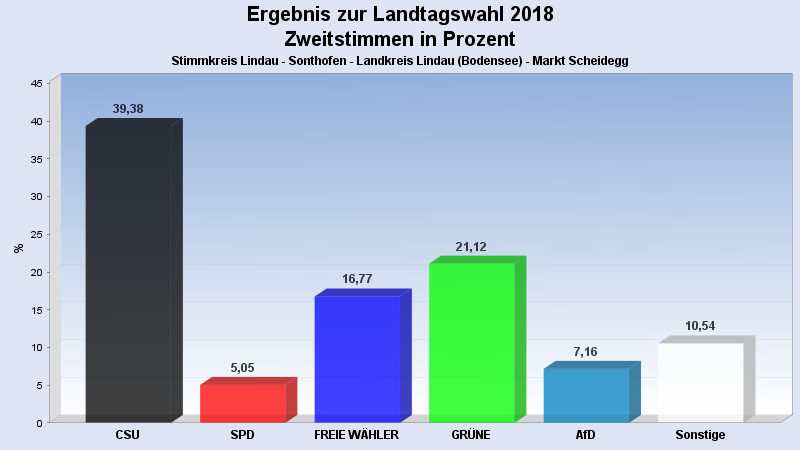
Wahlbeteiligung, Stimmzettel, Stimmen
| Wahlbeteiligung: | 72,80% |
|---|---|
| Stimmberechtigte: | 3.188 |
| Wähler: | 2.321 |
| Ungültige Erststimmen: | 22 |
| Gültige Erststimmen: | 2.299 |
| Ungültige Zweitstimmen: | 43 |
| Gültige Zweitstimmen: | 2.278 |
Erststimmen nach Wahlvorschlag
| Partei | Erststimmen | Prozent | |
|---|---|---|---|
| 1 | Beißwenger, Eric (CSU) | 765 | 33,28% |
| 2 | Maffenbeier, Michael (SPD) | 122 | 5,31% |
| 3 | Dr. Herz, Leopold (FREIE WÄHLER) | 420 | 18,27% |
| 4 | Gehring, Thomas (GRÜNE) | 572 | 24,88% |
| 5 | Dr. Spitzer, Dominik (FDP) | 126 | 5,48% |
| 6 | Schlotter, Michael (DIE LINKE) | 51 | 2,22% |
| 7 | Leising, Otto (BP) | 40 | 1,74% |
| 8 | Finger, Michael (ÖDP) | 24 | 1,04% |
| 10 | Keib, Axel (AfD) | 169 | 7,35% |
| 12 | Hüntemann, Matthias (mut) | 2 | 0,09% |
| 14 | Herzog, Stefan (V-Partei³) | 8 | 0,35% |
Zweitstimmen nach Wahlvorschlag
| Partei | Zweitstimmen | Prozent | |
|---|---|---|---|
| 1 | CSU | 897 | 39,38% |
| 2 | SPD | 115 | 5,05% |
| 3 | FREIE WÄHLER | 382 | 16,77% |
| 4 | GRÜNE | 481 | 21,12% |
| 5 | FDP | 89 | 3,91% |
| 6 | DIE LINKE | 55 | 2,41% |
| 7 | BP | 30 | 1,32% |
| 8 | ÖDP | 35 | 1,54% |
| 9 | PIRATEN | 14 | 0,61% |
| 10 | AfD | 163 | 7,16% |
| 11 | LKR | 1 | 0,04% |
| 12 | mut | 1 | 0,04% |
| 13 | Die PARTEI | 6 | 0,26% |
| 14 | V-Partei³ | 9 | 0,40% |
- Stand: 22.10.2018 16:29:09