OK.Wahl
Internetpräsentation
Version 2.2.12
Ergebnis zur Landtagswahl 2018 am 14.10.2018
Stimmkreis Lindau - Sonthofen - Landkreis Lindau (Bodensee) - Gemeinde Sigmarszell
Es wurden alle Stimmbezirke ausgewertet.
 Diagramm
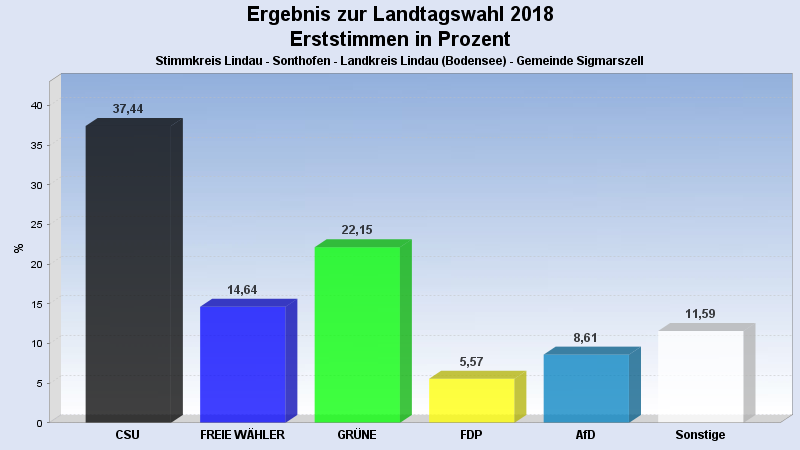
 Seitenanfang
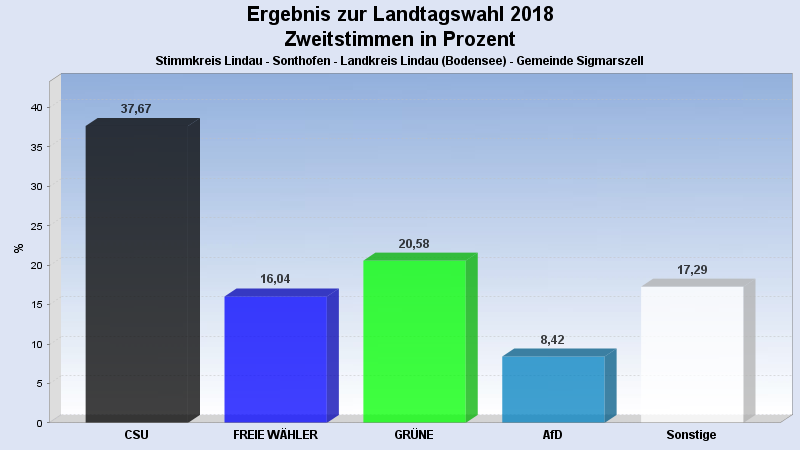
Wahlbeteiligung, Stimmzettel, Stimmen
| Wahlbeteiligung: | 72,23% |
|---|---|
| Stimmberechtigte: | 2.146 |
| Wähler: | 1.550 |
| Ungültige Erststimmen: | 6 |
| Gültige Erststimmen: | 1.544 |
| Ungültige Zweitstimmen: | 28 |
| Gültige Zweitstimmen: | 1.521 |
Erststimmen nach Wahlvorschlag
| Partei | Erststimmen | Prozent | |
|---|---|---|---|
| 1 | Beißwenger, Eric (CSU) | 578 | 37,44% |
| 2 | Maffenbeier, Michael (SPD) | 67 | 4,34% |
| 3 | Dr. Herz, Leopold (FREIE WÄHLER) | 226 | 14,64% |
| 4 | Gehring, Thomas (GRÜNE) | 342 | 22,15% |
| 5 | Dr. Spitzer, Dominik (FDP) | 86 | 5,57% |
| 6 | Schlotter, Michael (DIE LINKE) | 48 | 3,11% |
| 7 | Leising, Otto (BP) | 28 | 1,81% |
| 8 | Finger, Michael (ÖDP) | 19 | 1,23% |
| 10 | Keib, Axel (AfD) | 133 | 8,61% |
| 12 | Hüntemann, Matthias (mut) | 4 | 0,26% |
| 14 | Herzog, Stefan (V-Partei³) | 13 | 0,84% |
Zweitstimmen nach Wahlvorschlag
| Partei | Zweitstimmen | Prozent | |
|---|---|---|---|
| 1 | CSU | 573 | 37,67% |
| 2 | SPD | 66 | 4,34% |
| 3 | FREIE WÄHLER | 244 | 16,04% |
| 4 | GRÜNE | 313 | 20,58% |
| 5 | FDP | 69 | 4,54% |
| 6 | DIE LINKE | 43 | 2,83% |
| 7 | BP | 20 | 1,31% |
| 8 | ÖDP | 24 | 1,58% |
| 9 | PIRATEN | 10 | 0,66% |
| 10 | AfD | 128 | 8,42% |
| 11 | LKR | 0 | 0,00% |
| 12 | mut | 4 | 0,26% |
| 13 | Die PARTEI | 19 | 1,25% |
| 14 | V-Partei³ | 8 | 0,53% |
- Stand: 22.10.2018 16:29:21