OK.Wahl
Internetpräsentation
Version 2.2.12
Ergebnis zur Landtagswahl 2018 am 14.10.2018
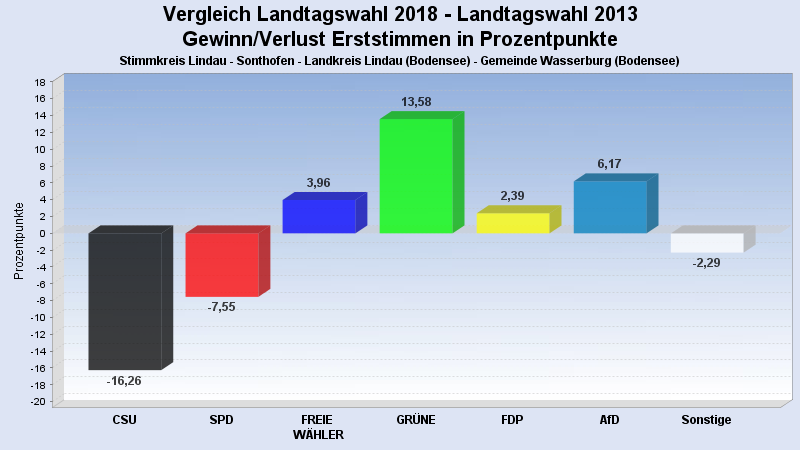
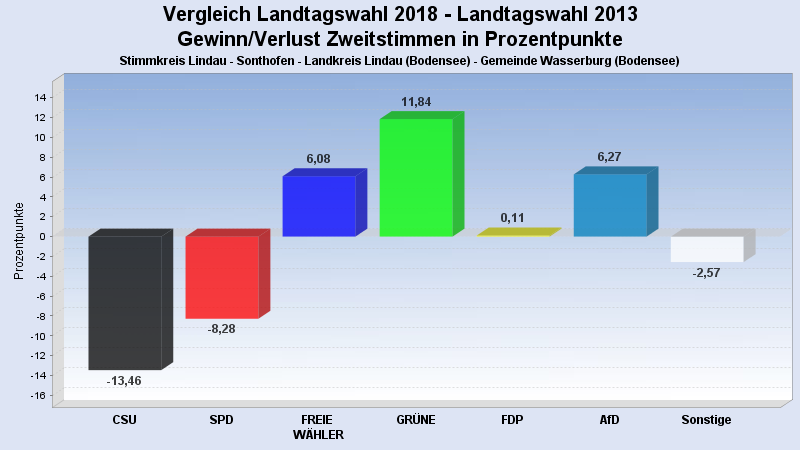
Stimmkreis Lindau - Sonthofen - Landkreis Lindau (Bodensee) - Gemeinde Wasserburg (Bodensee)
Es wurden alle Stimmbezirke ausgewertet.
 Diagramm
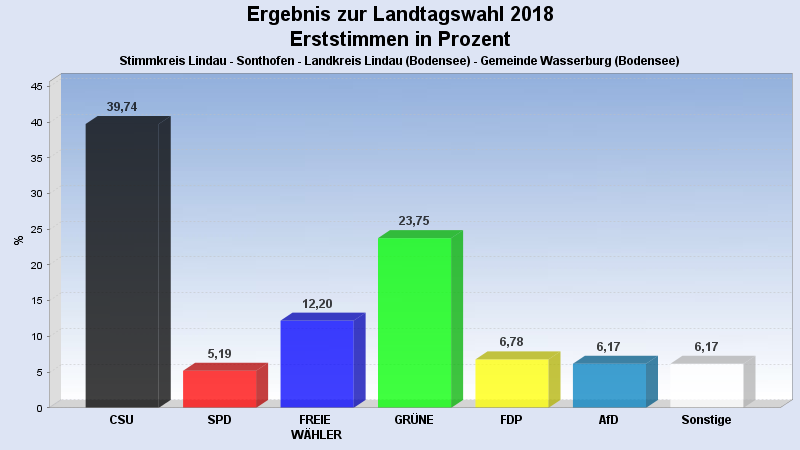
 Seitenanfang
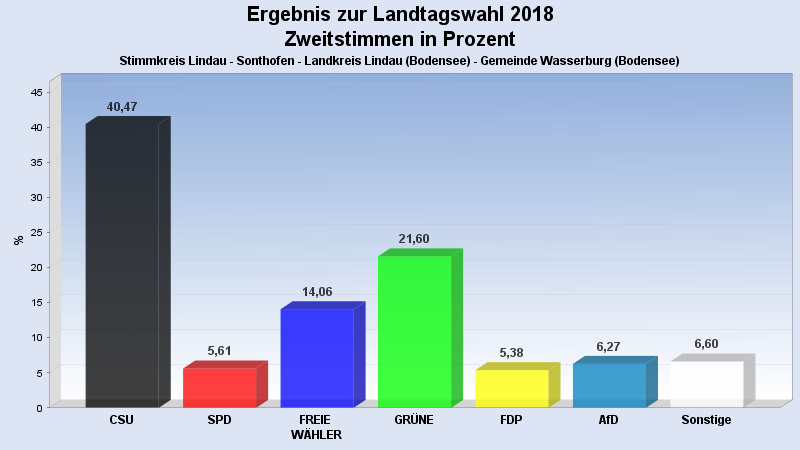
Wahlbeteiligung, Stimmzettel, Stimmen
| Wahlbeteiligung: | 74,02% |
|---|---|
| Stimmberechtigte: | 2.910 |
| Wähler: | 2.154 |
| Ungültige Erststimmen: | 15 |
| Gültige Erststimmen: | 2.139 |
| Ungültige Zweitstimmen: | 34 |
| Gültige Zweitstimmen: | 2.120 |
Erststimmen nach Wahlvorschlag
| Partei | Erststimmen | Prozent | |
|---|---|---|---|
| 1 | Beißwenger, Eric (CSU) | 850 | 39,74% |
| 2 | Maffenbeier, Michael (SPD) | 111 | 5,19% |
| 3 | Dr. Herz, Leopold (FREIE WÄHLER) | 261 | 12,20% |
| 4 | Gehring, Thomas (GRÜNE) | 508 | 23,75% |
| 5 | Dr. Spitzer, Dominik (FDP) | 145 | 6,78% |
| 6 | Schlotter, Michael (DIE LINKE) | 72 | 3,37% |
| 7 | Leising, Otto (BP) | 20 | 0,94% |
| 8 | Finger, Michael (ÖDP) | 16 | 0,75% |
| 10 | Keib, Axel (AfD) | 132 | 6,17% |
| 12 | Hüntemann, Matthias (mut) | 12 | 0,56% |
| 14 | Herzog, Stefan (V-Partei³) | 12 | 0,56% |
Zweitstimmen nach Wahlvorschlag
| Partei | Zweitstimmen | Prozent | |
|---|---|---|---|
| 1 | CSU | 858 | 40,47% |
| 2 | SPD | 119 | 5,61% |
| 3 | FREIE WÄHLER | 298 | 14,06% |
| 4 | GRÜNE | 458 | 21,60% |
| 5 | FDP | 114 | 5,38% |
| 6 | DIE LINKE | 71 | 3,35% |
| 7 | BP | 14 | 0,66% |
| 8 | ÖDP | 29 | 1,37% |
| 9 | PIRATEN | 8 | 0,38% |
| 10 | AfD | 133 | 6,27% |
| 11 | LKR | 0 | 0,00% |
| 12 | mut | 4 | 0,19% |
| 13 | Die PARTEI | 9 | 0,42% |
| 14 | V-Partei³ | 5 | 0,24% |
- Stand: 22.10.2018 16:29:31