OK.Wahl
Internetpräsentation
Version 2.2.12
Ergebnis zur Landtagswahl 2018 am 14.10.2018
Stimmkreis Lindau - Sonthofen - Landkreis Lindau (Bodensee) - Markt Weiler-Simmerberg
Es wurden alle Stimmbezirke ausgewertet.
 Diagramm
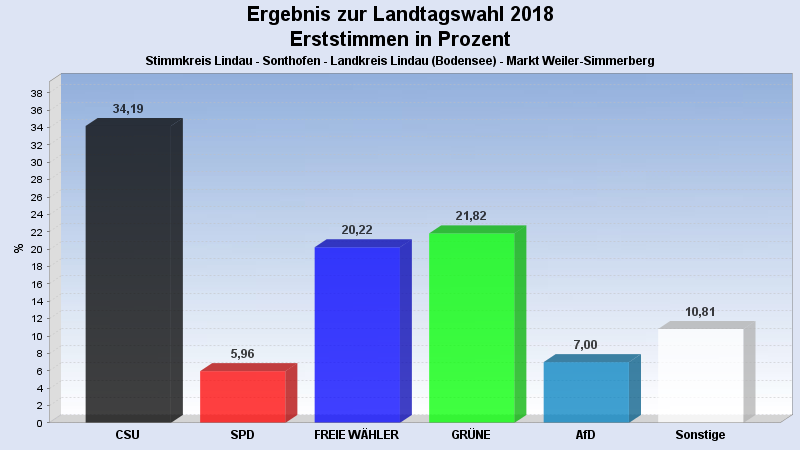
 Seitenanfang
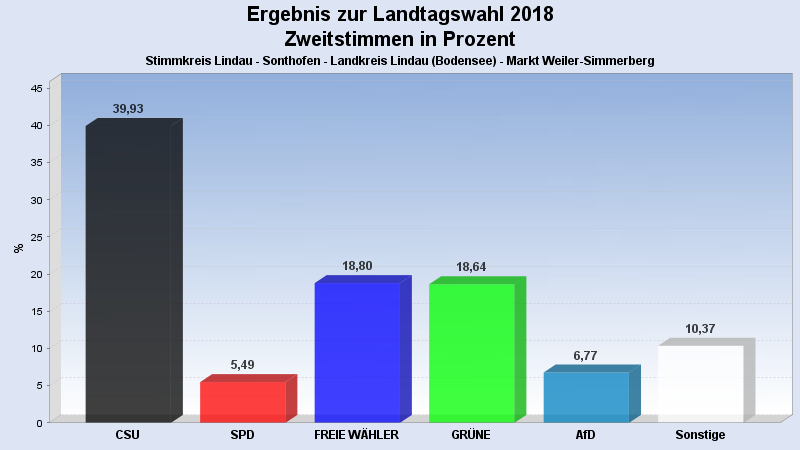
Wahlbeteiligung, Stimmzettel, Stimmen
| Wahlbeteiligung: | 67,19% |
|---|---|
| Stimmberechtigte: | 4.611 |
| Wähler: | 3.098 |
| Ungültige Erststimmen: | 27 |
| Gültige Erststimmen: | 3.071 |
| Ungültige Zweitstimmen: | 40 |
| Gültige Zweitstimmen: | 3.058 |
Erststimmen nach Wahlvorschlag
| Partei | Erststimmen | Prozent | |
|---|---|---|---|
| 1 | Beißwenger, Eric (CSU) | 1.050 | 34,19% |
| 2 | Maffenbeier, Michael (SPD) | 183 | 5,96% |
| 3 | Dr. Herz, Leopold (FREIE WÄHLER) | 621 | 20,22% |
| 4 | Gehring, Thomas (GRÜNE) | 670 | 21,82% |
| 5 | Dr. Spitzer, Dominik (FDP) | 148 | 4,82% |
| 6 | Schlotter, Michael (DIE LINKE) | 107 | 3,48% |
| 7 | Leising, Otto (BP) | 33 | 1,07% |
| 8 | Finger, Michael (ÖDP) | 29 | 0,94% |
| 10 | Keib, Axel (AfD) | 215 | 7,00% |
| 12 | Hüntemann, Matthias (mut) | 3 | 0,10% |
| 14 | Herzog, Stefan (V-Partei³) | 12 | 0,39% |
Zweitstimmen nach Wahlvorschlag
| Partei | Zweitstimmen | Prozent | |
|---|---|---|---|
| 1 | CSU | 1.221 | 39,93% |
| 2 | SPD | 168 | 5,49% |
| 3 | FREIE WÄHLER | 575 | 18,80% |
| 4 | GRÜNE | 570 | 18,64% |
| 5 | FDP | 101 | 3,30% |
| 6 | DIE LINKE | 102 | 3,34% |
| 7 | BP | 33 | 1,08% |
| 8 | ÖDP | 42 | 1,37% |
| 9 | PIRATEN | 12 | 0,39% |
| 10 | AfD | 207 | 6,77% |
| 11 | LKR | 2 | 0,07% |
| 12 | mut | 1 | 0,03% |
| 13 | Die PARTEI | 13 | 0,43% |
| 14 | V-Partei³ | 11 | 0,36% |
- Stand: 22.10.2018 16:29:38