OK.Wahl
Internetpräsentation
Version 2.2.12
Ergebnis zur Landtagswahl 2018 am 14.10.2018
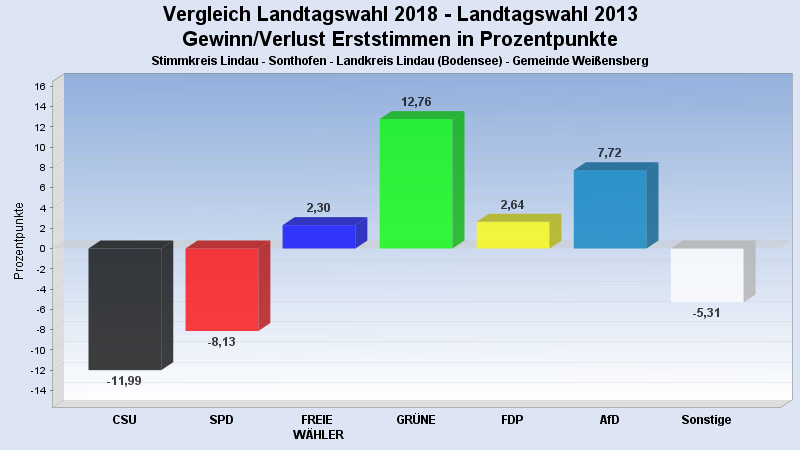
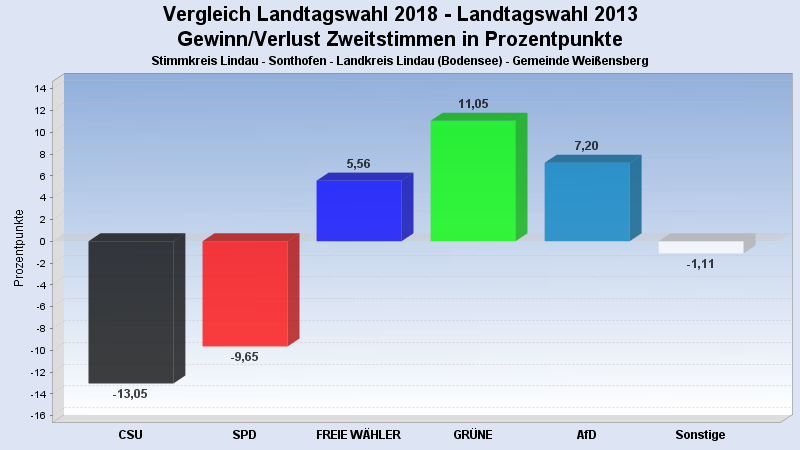
Stimmkreis Lindau - Sonthofen - Landkreis Lindau (Bodensee) - Gemeinde Weißensberg
Es wurden alle Stimmbezirke ausgewertet.
 Diagramm
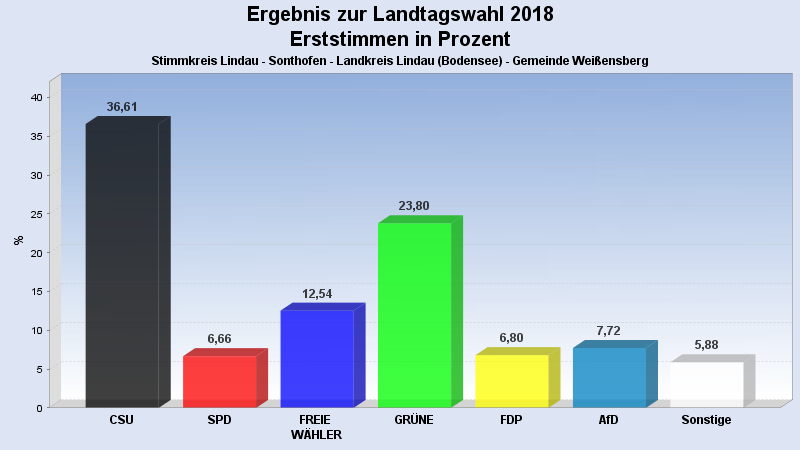
 Seitenanfang
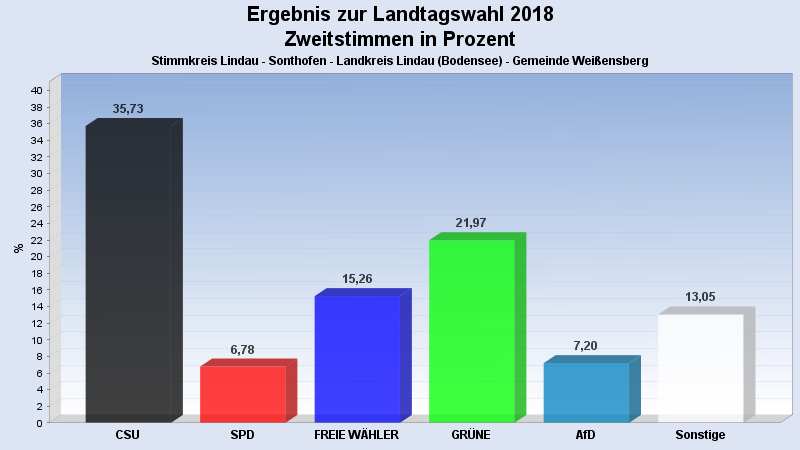
Wahlbeteiligung, Stimmzettel, Stimmen
| Wahlbeteiligung: | 72,98% |
|---|---|
| Stimmberechtigte: | 1.958 |
| Wähler: | 1.429 |
| Ungültige Erststimmen: | 17 |
| Gültige Erststimmen: | 1.412 |
| Ungültige Zweitstimmen: | 27 |
| Gültige Zweitstimmen: | 1.402 |
Erststimmen nach Wahlvorschlag
| Partei | Erststimmen | Prozent | |
|---|---|---|---|
| 1 | Beißwenger, Eric (CSU) | 517 | 36,61% |
| 2 | Maffenbeier, Michael (SPD) | 94 | 6,66% |
| 3 | Dr. Herz, Leopold (FREIE WÄHLER) | 177 | 12,54% |
| 4 | Gehring, Thomas (GRÜNE) | 336 | 23,80% |
| 5 | Dr. Spitzer, Dominik (FDP) | 96 | 6,80% |
| 6 | Schlotter, Michael (DIE LINKE) | 47 | 3,33% |
| 7 | Leising, Otto (BP) | 20 | 1,42% |
| 8 | Finger, Michael (ÖDP) | 10 | 0,71% |
| 10 | Keib, Axel (AfD) | 109 | 7,72% |
| 12 | Hüntemann, Matthias (mut) | 1 | 0,07% |
| 14 | Herzog, Stefan (V-Partei³) | 5 | 0,35% |
Zweitstimmen nach Wahlvorschlag
| Partei | Zweitstimmen | Prozent | |
|---|---|---|---|
| 1 | CSU | 501 | 35,73% |
| 2 | SPD | 95 | 6,78% |
| 3 | FREIE WÄHLER | 214 | 15,26% |
| 4 | GRÜNE | 308 | 21,97% |
| 5 | FDP | 70 | 4,99% |
| 6 | DIE LINKE | 47 | 3,35% |
| 7 | BP | 17 | 1,21% |
| 8 | ÖDP | 23 | 1,64% |
| 9 | PIRATEN | 6 | 0,43% |
| 10 | AfD | 101 | 7,20% |
| 11 | LKR | 0 | 0,00% |
| 12 | mut | 1 | 0,07% |
| 13 | Die PARTEI | 15 | 1,07% |
| 14 | V-Partei³ | 4 | 0,29% |
- Stand: 22.10.2018 16:29:48